Pandas

Plotting map in Python
https://www.nationalgeoportal.gov.np/#/metadata/98
installing required libraries
!pip install geopandas
!pip install geoplot
Importing libraries
import geoplot as gplt
import geopandas as gpd
import geoplot.crs as gcrs
import imageio
import pandas as pd
import pathlib
import matplotlib.pyplot as plt
import mapclassify as mc
import numpy as np
%matplotlib inlineRead The province data
path = '/content/drive/MyDrive/Colab Notebooks/Python_Course/Course_II/Draft/Data/province_2021_December_23_08_59_33/province/province.shp'
nepal_pro = gpd.read_file(path)
nepal_pro.head()
Plotting map
nepal_pro.plot(figsize=(10, 8))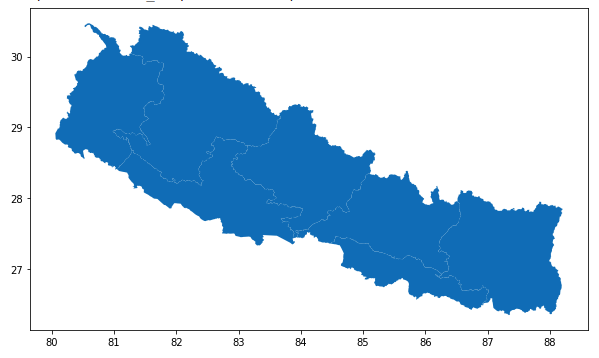
Boundaries
#Calculate boundaries
nepal_pro['boundary'] = nepal_pro.boundary
nepal_pro.head()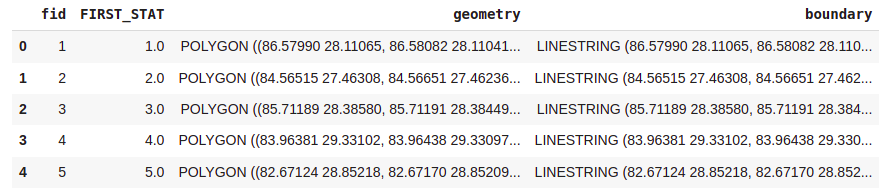
nepal_pro.boundary.plot(figsize=(10,8))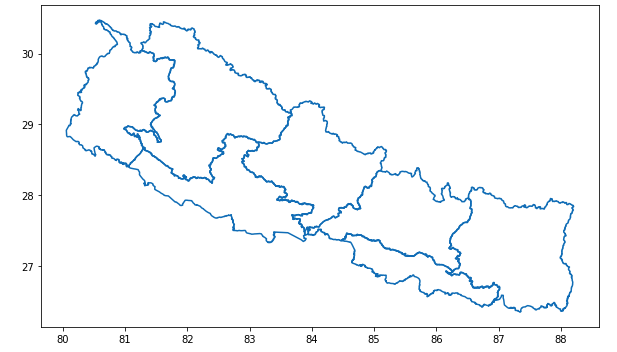
Centroid of all province
nepal_pro['centroid'] = nepal_pro.centroid
nepal_pro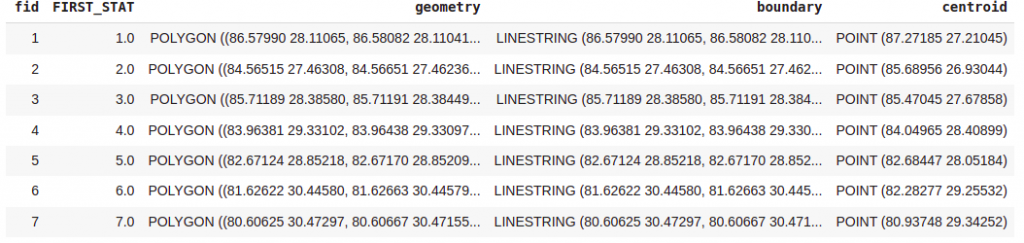
nepal_pro.centroid.plot(figsize=(10,8))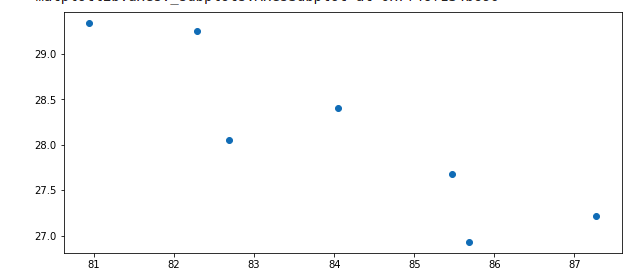
#putting province and their centroid together
cen = nepal_pro['centroid']
base = nepal_pro.plot(color='white', edgecolor='black',figsize=(10,8))
cen.plot(ax=base, marker='o', color='red', markersize=5)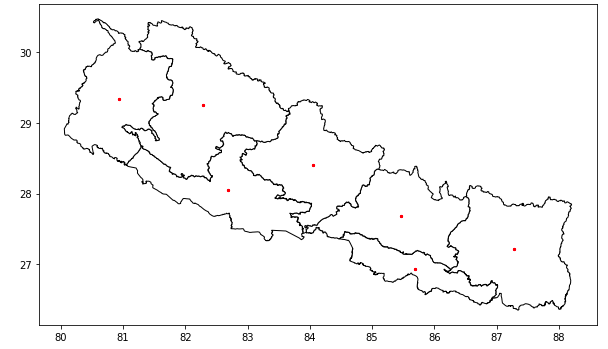
Area wise colormap plot of all province
area = [25905,9661,20300,21504,22288,27984,19915]
nepal_pro['area'] = area
nepal_pro.plot("area", legend=True,figsize=(10,8))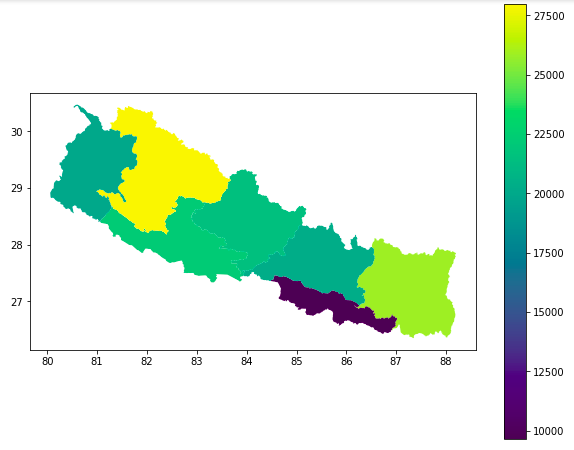
nepal_pro.plot(column='area',
           legend=True,
           legend_kwds={'label': "Area",
                        'orientation': "horizontal"},figsize=(10,8))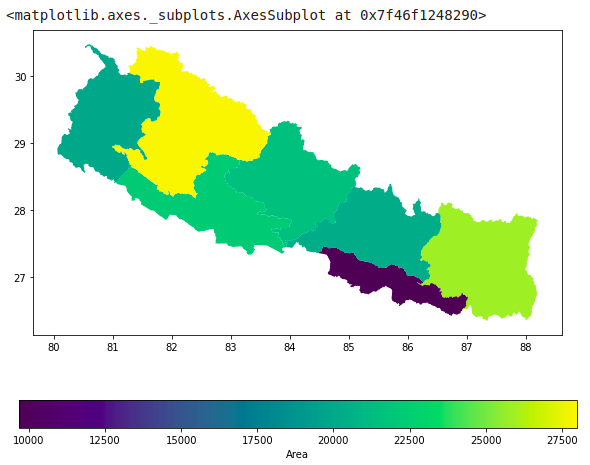
#https://matplotlib.org/2.0.2/users/colormaps.html
nepal_pro.plot(column='area',
           legend=True,
           legend_kwds={'label': "Area",
                        'orientation': "horizontal"},figsize=(10,8),cmap='jet')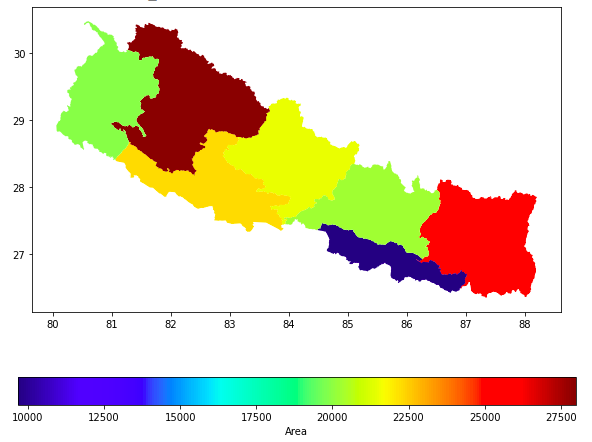
pontu
0