Pandas

Data Exploring And Analysis
Exploring and Analyzing a Series
import pandas as pd
import numpy as np
S1 = pd.Series([5,8,9,5,4,2])
print("Series mean Value : ",S1.mean())
print("Series max value : ",S1.max())
print("Series min value : ",S1.min())
print("Series standard deviation : ",S1.std())
Operation on a Series
print(5 in S1)
print(256 in S1)
S2 = S1 <5
print(S2)
S3 = S1[S1<5]
print('\n',S3)
S4 = S1[S1<5]*10
print('\n',S4)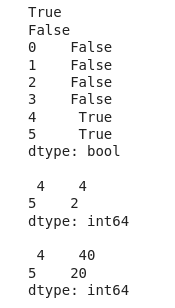
Exploring and Analyzing a Data Frame
#Creating a data fram with five attributes
data = {'Age':[30,32,35,63],
        'Salary':[25,36,52,89],
        'Height':[150,180,172,175],
        'Weight':[98,85,75,82],
        'Gender':['Male','Female','Female','Male']}
data = pd.DataFrame(data,index=['Adlof','Kate','Neha','Bir'])
data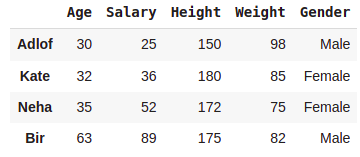
#Adding another row (or DataFrame with single Row)
df2 = pd.DataFrame([[23,32,145,55,'Female']],
                   columns = ['Age','Salary','Height','Weight','Gender'],
                   index=['Mona'])
data = data.append(df2)
data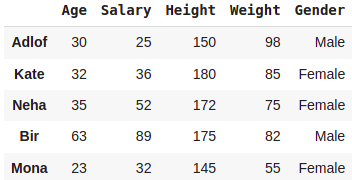
data.describe()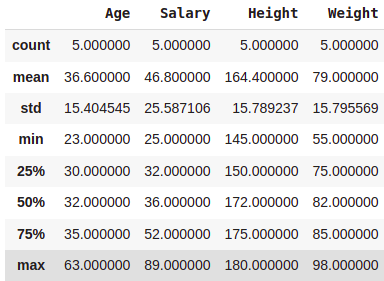
data.describe(include='all')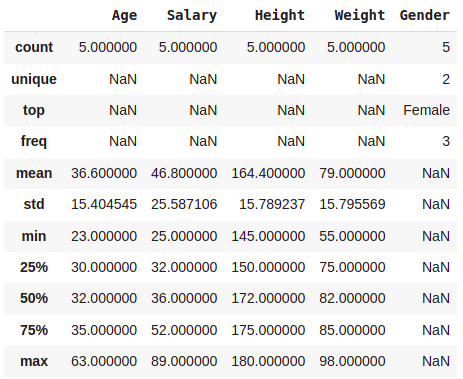
data.Salary.describe()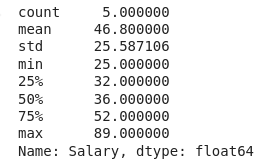
data['Salary'].describe()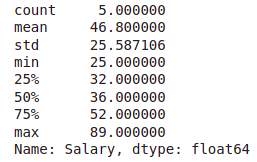
#Analyzing only numerical patterns
data.describe(include=[np.number])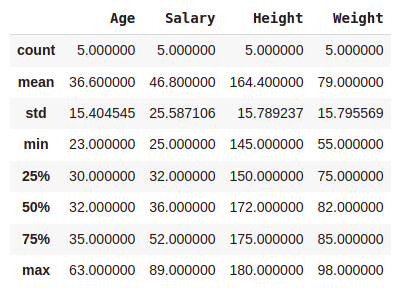
#Analyzing Strings Patterns Only
data.describe(include=[np.object])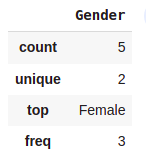
data.describe(exclude=[np.number])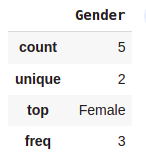
Optimal_Salary = data['Salary'] >= 35
Optimal_Salary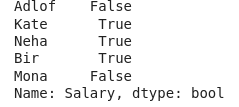
#Correlation
data.corr()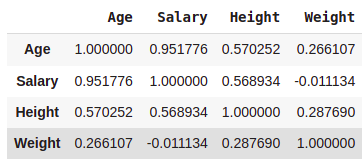
data.count()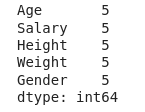
data.min()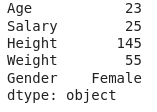
Data Grouping
Number = [1,2,3,4,5,6,7,8,9,10]
Names = ['Ali','Aryan','Arya','Bipul','Vivek','Sahil',
         'Surya','Shere','Sahid','Reema']
City = ['Dubai','Karanchi','Paris','Perth','Oslo',
        'Lisbon','Berlin','Dubai','Oslo','Dubai']
Gender = ['Male','Male','Female','Male','Male',
          'Male','Male','Male','Male','Female']

Height = [120,130,150,200,180,
          175,178,172,168,150]
Weight = [85,95,62,54,15,
          96,123,41,52,65]
dataset = pd.DataFrame({'Number':Number,'Names':Names,'City':City,
                        'Height':Height,'Weight':Weight,'Gender':Gender})
dataset.head()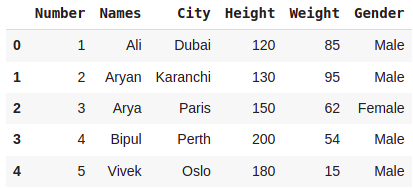
dataset.groupby('City').count()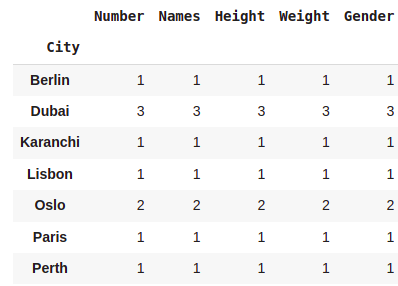
dataset.groupby(['City','Gender']).count()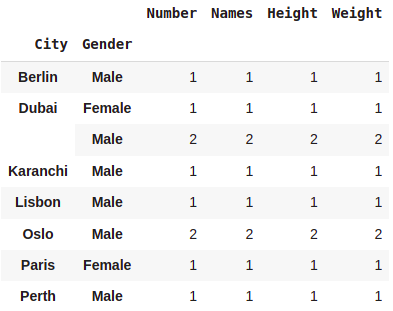
grouped = dataset.groupby('City')
print(grouped.get_group('Dubai'))
Data Aggregation
dataset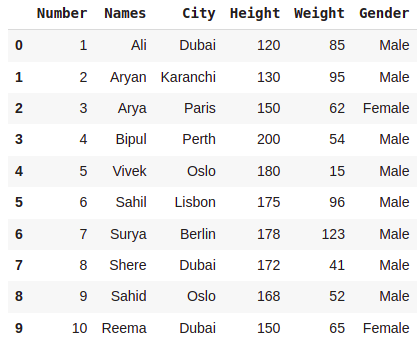
dataset.set_index('Number')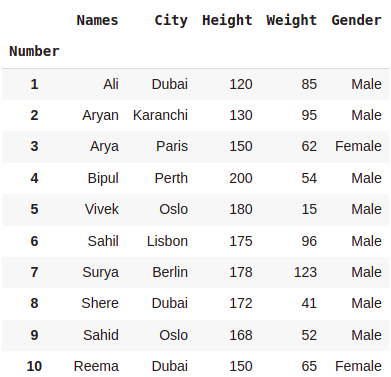
grouped = dataset.groupby('Gender')
print(grouped['Height'].agg(np.mean))
print("\n")
print(grouped['Weight'].agg([np.mean,np.sum,np.std]))
print("\n")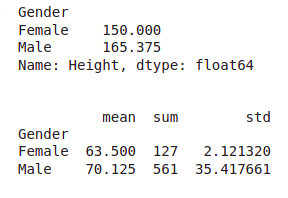
#Transforming data
dataset = dataset.set_index('Number')
score = lambda x:(x-x.mean())/x.std()*10
print(grouped.transform(score))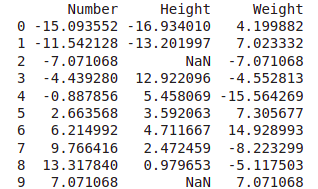
Filtration
dataset.groupby('City').filter(lambda x :len(x)>=2)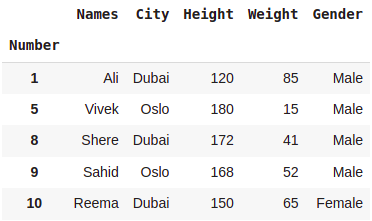
dataset.filter(['City','Height'])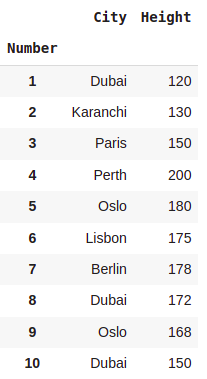
# Using regular expression to extract all
# columns which has letter 'a' or 'A' in its name.
dataset.filter(regex ='[aA]')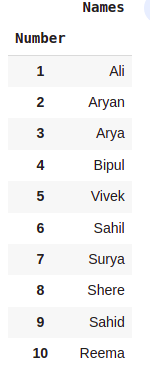
dataset[(dataset.Height > 150) & (dataset.Weight < 90)]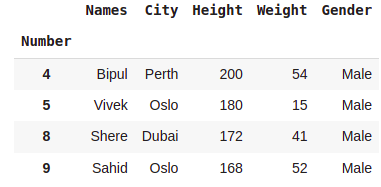
dataset[(dataset.Height > 150) | (dataset.Weight > 90)]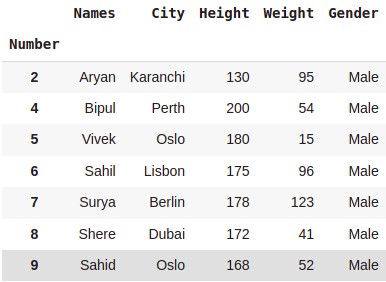
dataset[dataset.City.str.startswith('K')]
dataset[dataset.City.str.contains('i')]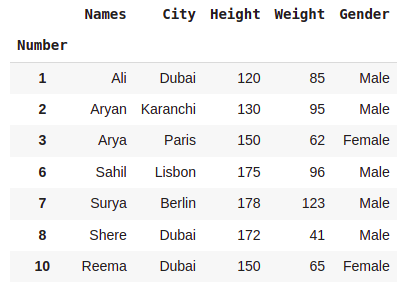
dataset[dataset.Names.str.contains('i','a')]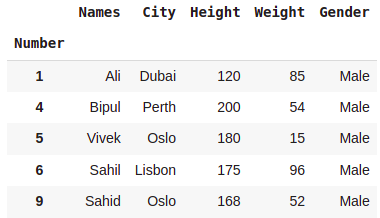
dataset[~dataset.City.str.startswith('K')]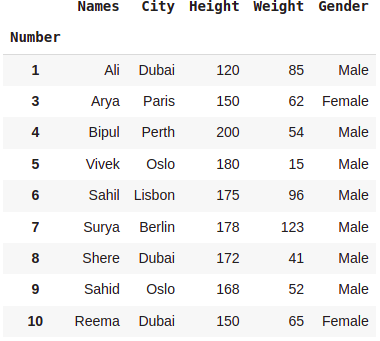
dataset.query('City == "Dubai" and Height > 120')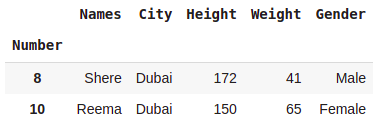
#Selecting row with 3 largest values in column Height
dataset.nlargest(3, 'Height')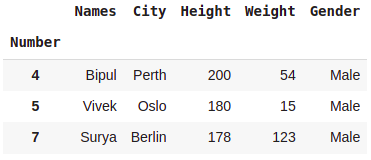
#Selecting row with 2 smallest values in column Height
dataset.nsmallest(2, 'Height')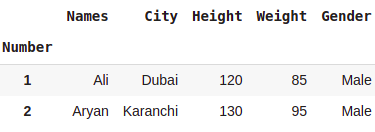
dataset.iloc[3:5, :] #rows 3 and 4, all columns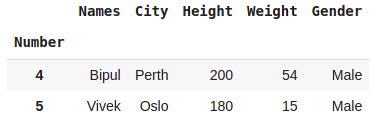
#rows 3 and 4, all columns
dataset.loc[3:5,:]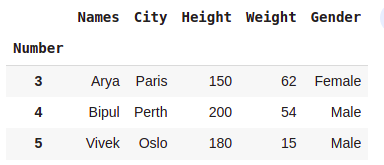
#Changing index of dataset to show difference between loc and iloc
dataset.index = ['a','b','c','d','e','f','g','h','i','j']
#rows 3 and 4, all columns
dataset.loc[3:5,:]
#This will generetae error#rows 3 and 4, all columns
dataset.iloc[3:5,:]
#rows 3 and 4, all columns
dataset.iloc['c':'e',:]
#This will generate error
#rows 3 and 4, all columns
dataset.loc['c':'e',:]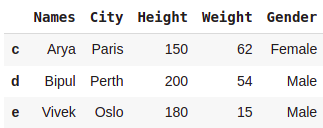
ponru
0