Data Analysis Flask App on Heroku
Create a virtual Environment
mkdir Crosstab_webapp
cd Crosstab_webapp
python3 -m venv venv
source venv/bin/activate
Install github
type -p curl >/dev/null || sudo apt install curl -y
curl -fsSL https://cli.github.com/packages/githubcli-archive-keyring.gpg | sudo dd of=/usr/share/keyrings/githubcli-archive-keyring.gpg \
&& sudo chmod go+r /usr/share/keyrings/githubcli-archive-keyring.gpg \
&& echo "deb [arch=$(dpkg --print-architecture) signed-by=/usr/share/keyrings/githubcli-archive-keyring.gpg] https://cli.github.com/packages stable main" | sudo tee /etc/apt/sources.list.d/github-cli.list > /dev/null \
&& sudo apt update \
&& sudo apt install gh -y
sudo apt update
sudo apt install ghgh auth loginCreate a Git repo
gh repo create
#Then walk through
#For more instructions
Create dir and push it to github repository
#Inside the new directory created for git repo
touch app.py
mkdir templates staticFiles
touch templates/index.html
git add .
git commit -m "Basic Files"
git push -m origin mainapp.py
pip3 install flask#imports Flask from the package flask
from flask import Flask
#This creates an instance of the Flask object using #our module's name as a parameter.
#Flask uses this to resolve resources
app = Flask(__name__)
#Following line is python decorator.
#Flask uses decorators for URL routing, so this line #of code means that the function directly below it #should be called whenever a user visits the main #root page of our web application.
@app.route("/")
#Following line define a function and returns our #message.
def index():
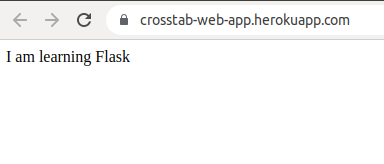
return "I am learning Flask"
Adding changes to git
git add .
git commit -m 'basic flask app'
git push -u origin main
Putting it on Heroku
#Create an account on Heroku
curl https://cli-assets.heroku.com/install-ubuntu.sh | shheroku loginecho "web: gunicorn app:app" > Procfilepython3 -m pip install gunicorn==20.0.4python3 -m pip freeze>reuirements.txtgit add .
git commit -m 'requirements added'#heroku create <unique_name_of_app>
heroku create crosstab-web-app
git push heroku main
heroku open#pushing a copy to github
git push -u origin mainOutput:
Making a Flask App to upload and display a csv file
export FLASK_ENV=development
or
export FLASK_DEBUG=true
pip3 install pandasapp.py
from pydoc_data.topics import topics
from flask import Flask, render_template, request, session,redirect
import os
from werkzeug.utils import secure_filename
import pandas as pd
Flag = 0
csv_file_path = ""
#Defining upload folder path
UPLOAD_FOLDER = os.path.join('staticFiles','uploads')
#Define allowed files
ALLOWED_EXTENSIONS = {'csv'}
app = Flask(__name__,template_folder='templates',static_folder='staticFiles')
app.config['UPLOAD_FOLDER'] = UPLOAD_FOLDER
#Define secret key to enable session
app.secret_key = "sanaan"
column_names = ''
row_data = ''
@app.route('/',methods=("POST","GET"))
def index():
img_file_path = ""
if request.method =='POST':
if request.form.get('Submit_action')=='Submit':
#upload file flask
uploaded_file = request.files['uploaded-file']
print(uploaded_file.filename)
uploaded_file.save(os.path.join(app.config['UPLOAD_FOLDER'],'upload.csv'))
#Storing uploaded file path in flask session
session['uploaded_csv_file_path'] = os.path.join(app.config['UPLOAD_FOLDER'],'upload.csv')
#retriving uploaded file path from session
csv_file_path = session.get('uploaded_csv_file_path',None)
print(csv_file_path)
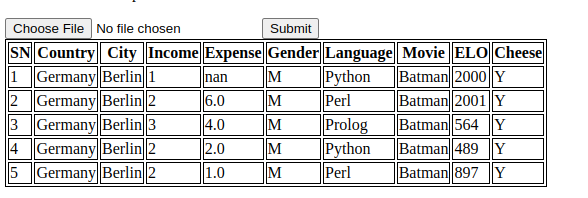
df = pd.read_csv(csv_file_path)
print(df.head())
column_names = df.columns.values
row_data = list(df.head().values.tolist())
else:
pass
else:
csv_file_path = ""
column_names=""
row_data=""
return render_template('index.html',column_names=column_names, row_data=row_data, zip=zip)
#Running the app
if __name__ == '__main__':
app.run(port=5000,debug=True)index.html
<!DOCTYPE html>
<html lang="en">
<head>
<link rel="stylesheet" href="/staticFiles/main.css"/>
</head>
<body>
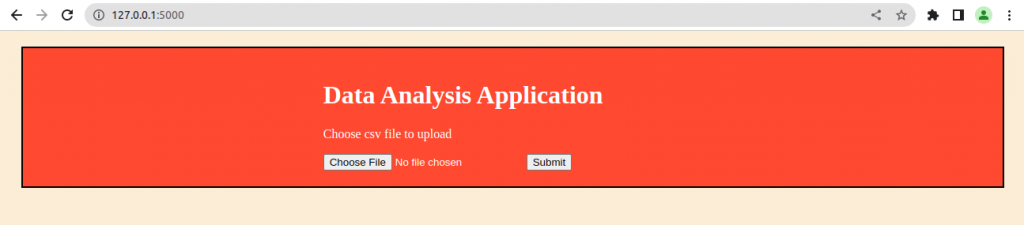
<div class="main">
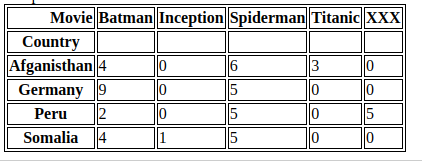
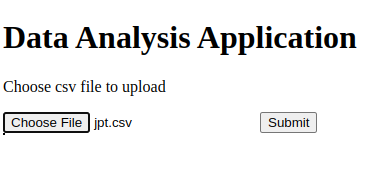
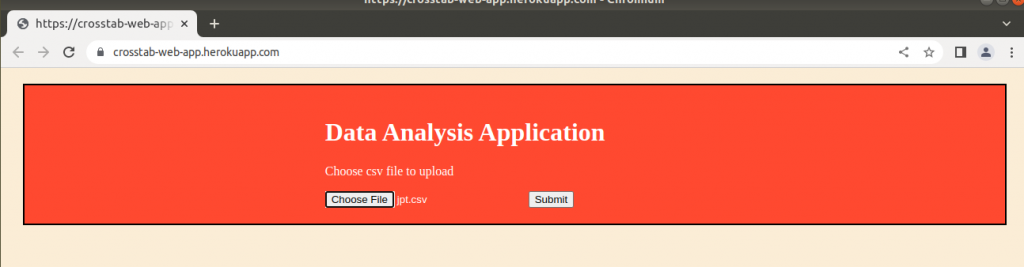
<h1>Data Analysis Application</h1>
<p>Choose csv file to upload</p>
<form method="POST" enctype="multipart/form-data" action="/">
<input type="file" id="myFile" name="uploaded-file" accept=".csv">
<input type="submit" value="Submit" name="Submit_action">
</form>
</div>
<table>
<thead>
<tr>
{% for col in column_names %}
<th>
{{col}}
</th>
{% endfor %}
</tr>
</thead>
<tbody>
{% for row in row_data %}
<tr>
{% for col, row_ in zip(column_names, row) %}
<td>{{row_}}</td>
{% endfor %}
</tr>
{% endfor %}
</tbody>
</table>
</body>
</html>cd staticFiles
mkdir uploads
cd ..Adding files in heroku
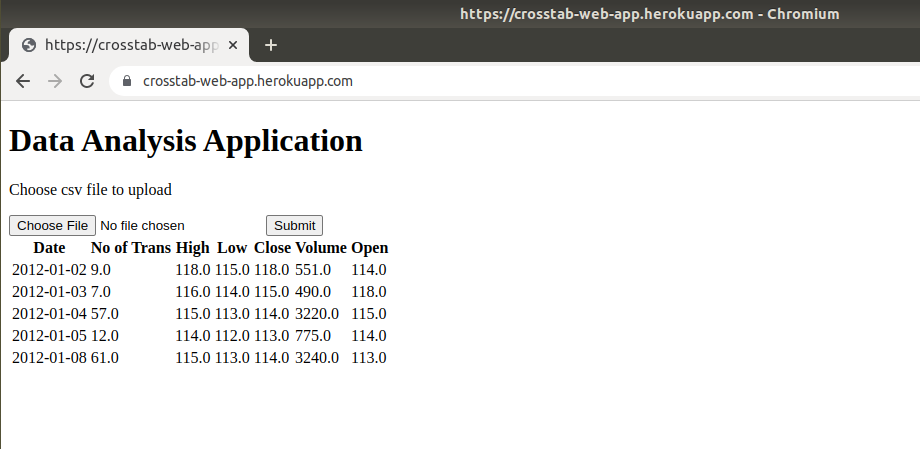
python3 -m pip freeze > requirements.txtgit push heroku main
heroku openOutput:
Basic Crosstab
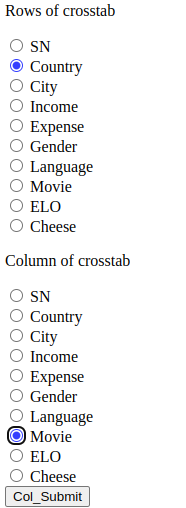
We pass the list of columns in the uploaded dataframe to generate two sets of radio buttons. The first set is for selection of rows (stubs) of crosstab and second is for columns (banners) of crosstab.
Following code is the code using jinja to iterate value of columns passed by the app.py to index.html.
{% if column_names[0] %}
<p>Rows (stubs) of crosstab</p>
<form name="df_column_selection" action="/" method="POST">
{% for column in column_names %}
<input type="radio" id="df_column_selection" name="df_column_selection" value="{{column}}">
<label for="{{column}}">{{column}}</label><br>
{% endfor %}
</select>
<p>Column (banners) of crosstab</p>
{% for column in column_names %}
<input type="radio" id="df_column_selection2" name="df_column_selection2" value="{{column}}">
<label for="{{column}}">{{column}}</label><br>
{% endfor %}
<input type="submit" value="Col_Submit" name="Submit_action">
</form>
{% endif %}After selection of stubs and banners, we pass them back to app.py.
#Check the forms with buttons are submitted or not
elif request.form.get('Submit_action')=='Col_Submit':
print('Columns selected')
#The index of crosstab
index_list = request.form.get("df_column_selection")
print(index_list)
#The column of crosstab
column_list = request.form.get("df_column_selection2")
print(column_list)
#Calling the crosstab function of pandas
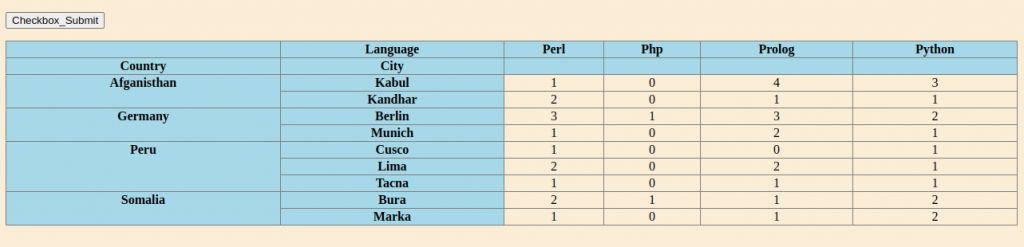
output_df = pd.crosstab(df[index_list],df[column_list])
print(output_df)
#Generating the tables for html tables
tables = [output_df.to_html(classes='data')]
#Generating the titles for html table
titles = output_df.columns.valuestables and titles are passed to the index.html
The dataframe generated as result of pandas crosstab is populated in html as follows.
{% for table in tables %}
{{titles[loop.index]}}
{{ table|safe }}
{% endfor %}Output: So Far
/
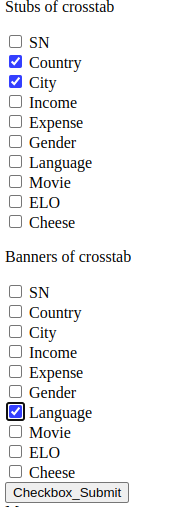
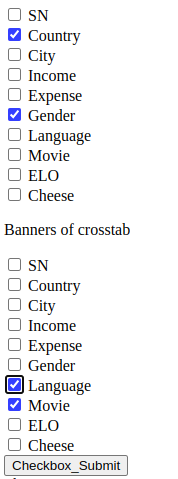
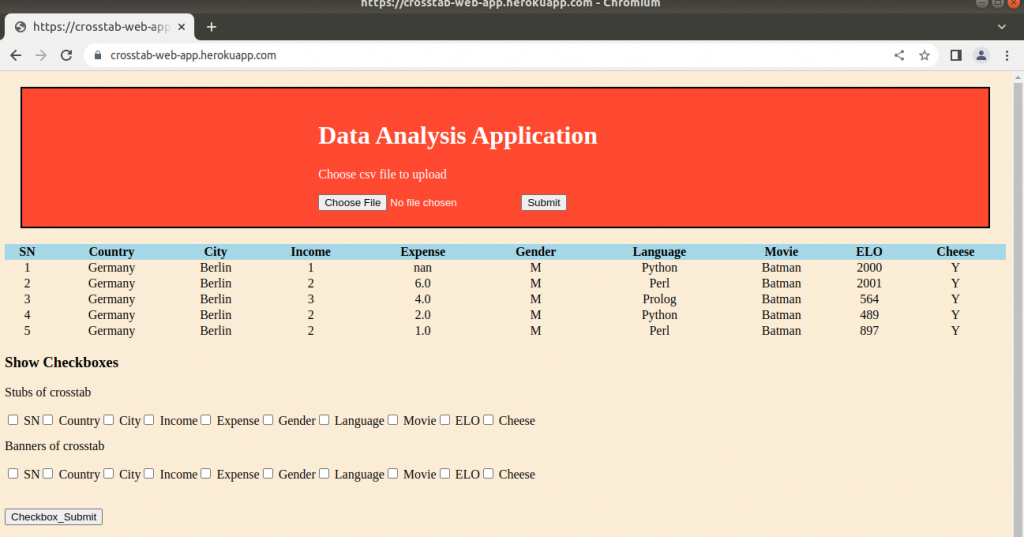
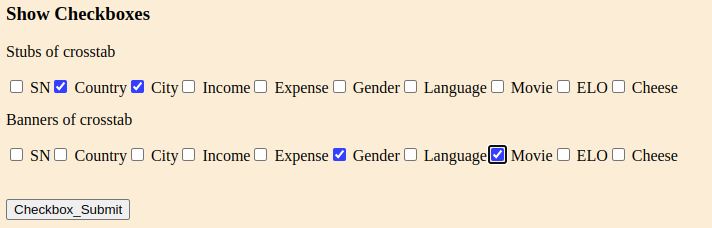
Adding Checkboxes and removing Radio buttons so that multiple rows and columns can be processed in crosstab.
Code for checkboxes in index.html
{% if column_names[0] %}
<h3>Show Checkboxes</h3>
<form name="df_checkbox" action="/" method="POST">
<p>Stubs of crosstab</p>
{% for column in column_names %}
<input type="checkbox" id="{{column}}" name="checkbox_rows" value="{{column}}">
<label for="{{column}}">{{column}}</label><br>
{% endfor %}
<p>Banners of crosstab</p>
{% for column in column_names %}
<input type="checkbox" id="{{column}}" name="checkbox_columns" value="{{column}}">
<label for="{{column}}">{{column}}</label><br>
{% endfor %}
<input type="submit" value="Checkbox_Submit" name="Checkbox_action">
</form>
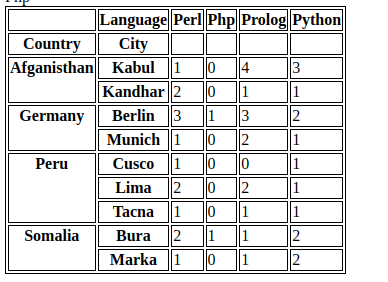
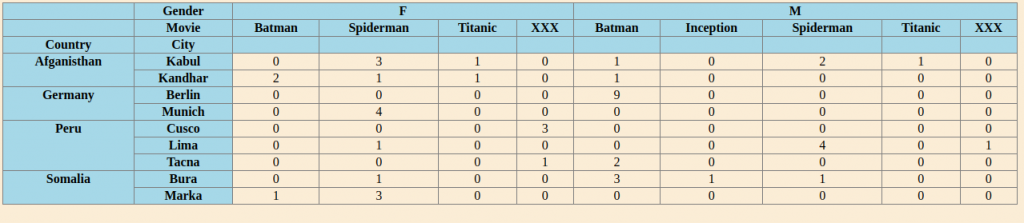
{% endif %}Code in app.py to read the submitted data from checkboxs and perform crosstabulation before sending the output table of cross tabulation back to index.html
elif request.form.get('Checkbox_action')=='Checkbox_Submit':
print('Checkbox used')
#The index of crosstab
index_list = request.form.getlist("checkbox_rows")
print(index_list)
#The column of crosstab
column_list = request.form.getlist("checkbox_columns")
print(column_list)
#Rereading the uploaded file and getting data
csv_file_path = session.get('uploaded_csv_file_path',None)
print(csv_file_path)
df = pd.read_csv(csv_file_path)
print(df.head())
column_names = df.columns.values
column_names = column_names.tolist()
row_data = list(df.head().values.tolist())
print(column_names)
tables=""
titles=""
if(len(index_list)==1 and len(column_list)==1):
index_crosstab = [df[index_list[0]]]
col_crosstab = df[column_list[0]]
elif(len(index_list)==2 and len(column_list)==1):
index_crosstab = [df[index_list[0]],df[index_list[1]]]
col_crosstab = df[column_list[0]]
elif(len(index_list)==1 and len(column_list)==2):
index_crosstab = [df[index_list[0]]]
col_crosstab = [df[column_list[0]],df[column_list[1]]]
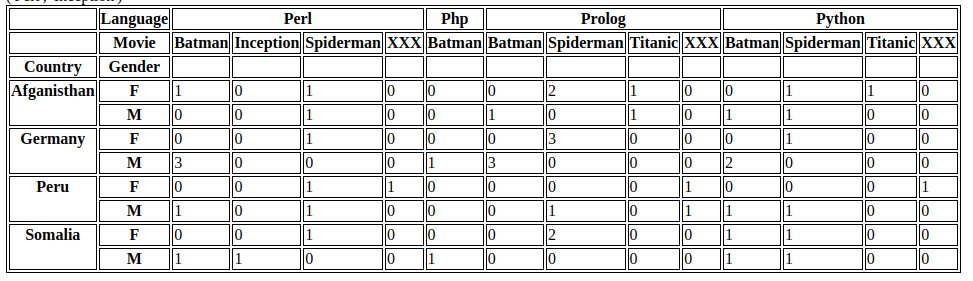
elif(len(index_list)==2 and len(column_list)==2):
index_crosstab = [df[index_list[0]],df[index_list[1]]]
col_crosstab = [df[column_list[0]],df[column_list[1]]]
#Calling the crosstab function of pandas
output_df = pd.crosstab(index_crosstab,col_crosstab)
print(output_df)
#Generating the tables for html tables
tables = [output_df.to_html(classes='data')]
#Generating the titles for html table
titles = output_df.columns.values
Output: So Far
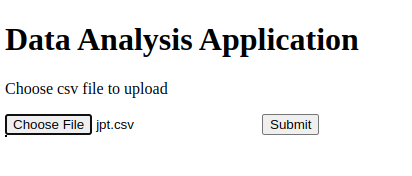
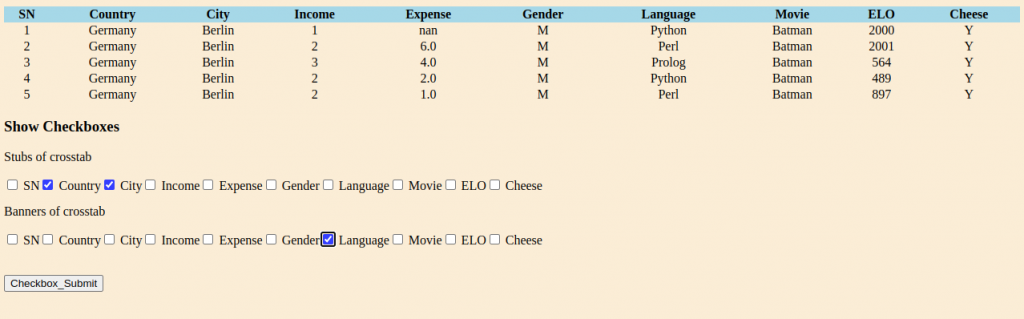
Adding CSS
Code for main.css
body {
background-color: antiquewhite;
}
.main {
background-color: tomato;
color: white;
border: 2px solid black;
margin: 20px;
padding: 20px;
}
.center {
margin: auto;
width: 40%;
}
.table_center {
display: flex;
justify-content: center;
}
#horizontal_check_box {
float:left;
}
table, th, td {
text-align: center;
}
th {
background: lightblue;
}
table {
border-collapse: collapse;
width: 100%;
}
Current code for index.html
<!DOCTYPE html>
<html lang="en">
<head>
<link rel="stylesheet" href="/staticFiles/main.css"/>
</head>
<body>
<div class="main">
<div class="center">
<h1>Data Analysis Application</h1>
<p>Choose csv file to upload</p>
<form method="POST" enctype="multipart/form-data" action="/">
<input type="file" id="myFile" name="uploaded-file" accept=".csv">
<input type="submit" value="Submit" name="Submit_action">
</form>
</div>
</div>
{% if column_names[0] %}
<div class="table_center">
<table>
<thead>
<tr>
{% for col in column_names %}
<th>
{{col}}
</th>
{% endfor %}
</tr>
</thead>
<tbody>
{% for row in row_data %}
<tr>
{% for col, row_ in zip(column_names, row) %}
<td>{{row_}}</td>
{% endfor %}
</tr>
{% endfor %}
</tbody>
</table>
</div>
{% endif %}
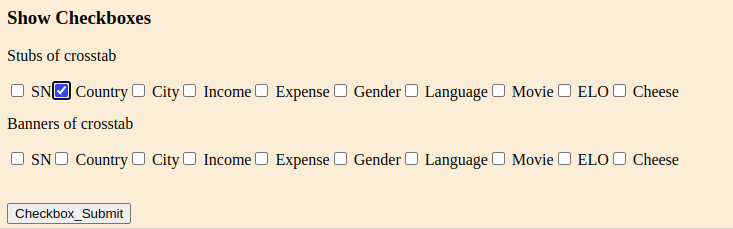
{% if column_names[0] %}
<h3>Show Checkboxes</h3>
<form name="df_checkbox" action="/" method="POST">
<p>Stubs of crosstab</p>
{% for column in column_names %}
<div id="horizontal_check_box">
<input type="checkbox" id="{{column}}" name="checkbox_rows" value="{{column}}">
<label for="{{column}}">{{column}}</label><br>
</div>
{% endfor %}
<br>
<p>Banners of crosstab</p>
{% for column in column_names %}
<div id="horizontal_check_box">
<input type="checkbox" id="{{column}}" name="checkbox_columns" value="{{column}}">
<label for="{{column}}">{{column}}</label><br>
</div>
{% endfor %}
<br>
<br>
<br>
<div style="float: left;">
<input type="submit" value="Checkbox_Submit" name="Checkbox_action">
</div>
</form>
{% endif %}
<br>
<br>
<div class="table_center">
{% for table in tables %}
{{ table|safe }}
{% endfor %}
</div>
<br>
<br>
<br>
<br>
</body>
</html>current code for app.py
from pydoc_data.topics import topics
from flask import Flask, render_template, request, session,redirect
import os
from werkzeug.utils import secure_filename
import pandas as pd
Flag = 0
csv_file_path = ""
#Defining upload folder path
UPLOAD_FOLDER = os.path.join('staticFiles','uploads')
#Define allowed files
ALLOWED_EXTENSIONS = {'csv'}
app = Flask(__name__,template_folder='templates',static_folder='staticFiles')
app.config['UPLOAD_FOLDER'] = UPLOAD_FOLDER
#Define secret key to enable session
app.secret_key = "sanaan"
column_names = ''
row_data = ''
@app.route('/',methods=("POST","GET"))
def index():
if request.method =='POST':
if request.form.get('Submit_action')=='Submit':
#upload file flask
uploaded_file = request.files['uploaded-file']
print(uploaded_file.filename)
uploaded_file.save(os.path.join(app.config['UPLOAD_FOLDER'],'upload.csv'))
#Storing uploaded file path in flask session
session['uploaded_csv_file_path'] = os.path.join(app.config['UPLOAD_FOLDER'],'upload.csv')
#retriving uploaded file path from session
csv_file_path = session.get('uploaded_csv_file_path',None)
print(csv_file_path)
df = pd.read_csv(csv_file_path)
print(df.head())
column_names = df.columns.values
column_names = column_names.tolist()
row_data = list(df.head().values.tolist())
print(column_names)
print(type(column_names))
tables=""
titles=""
elif request.form.get('Checkbox_action')=='Checkbox_Submit':
print('Checkbox used')
#The index of crosstab
index_list = request.form.getlist("checkbox_rows")
print(index_list)
#The column of crosstab
column_list = request.form.getlist("checkbox_columns")
print(column_list)
#Rereading the uploaded file and getting data
csv_file_path = session.get('uploaded_csv_file_path',None)
print(csv_file_path)
df = pd.read_csv(csv_file_path)
print(df.head())
column_names = df.columns.values
column_names = column_names.tolist()
row_data = list(df.head().values.tolist())
print(column_names)
tables=""
titles=""
if(len(index_list)==1 and len(column_list)==1):
index_crosstab = [df[index_list[0]]]
col_crosstab = df[column_list[0]]
elif(len(index_list)==2 and len(column_list)==1):
index_crosstab = [df[index_list[0]],df[index_list[1]]]
col_crosstab = df[column_list[0]]
elif(len(index_list)==1 and len(column_list)==2):
index_crosstab = [df[index_list[0]]]
col_crosstab = [df[column_list[0]],df[column_list[1]]]
elif(len(index_list)==2 and len(column_list)==2):
index_crosstab = [df[index_list[0]],df[index_list[1]]]
col_crosstab = [df[column_list[0]],df[column_list[1]]]
#Calling the crosstab function of pandas
output_df = pd.crosstab(index_crosstab,col_crosstab)
print(output_df)
#Generating the tables for html tables
tables = [output_df.to_html(classes='data')]
#Generating the titles for html table
titles = output_df.columns.values
else:
pass
else:
csv_file_path = ""
column_names=""
row_data=""
tables=""
titles=""
return render_template('index.html',column_names=column_names, row_data=row_data, tables=tables, titles=titles,zip=zip)
#Running the app
if __name__ == '__main__':
app.run(port=5000,debug=True)Output: So Far
Adding Horizontal Bar Chart
Code for app.py
#plotting figure
plt.figure()
ax = output_df.plot(kind='barh',figsize=(12,6),stacked=True)
ax.yaxis.set_tick_params(labelsize=7)
for bars in ax.containers:
ax.bar_label(bars)
plt.legend(loc='best')
# Save it to a temporary buffer.
buf = BytesIO()
plt.savefig(buf, format="jpg")
plt.savefig(os.path.join(app.config['UPLOAD_FOLDER'],'plot.jpg'))
plot_url = base64.b64encode(buf.getvalue()).decode('utf8')Code for index.html
<div class="img_center">
{% if plot_url %}
<img src="data:image/jpg;base64, {{ plot_url }}">
{% endif %}
</div>Code for main.css
.img_center {
display: flex;
justify-content: center;
}Exception Handling and Flash Message
Code for app.py
try:
output_df = pd.crosstab(index_crosstab,col_crosstab)
print('this is output df')
print(output_df)
#plotting figure
plt.figure()
ax = output_df.plot(kind='barh',figsize=(12,6),stacked=True)
ax.yaxis.set_tick_params(labelsize=7)
for bars in ax.containers:
ax.bar_label(bars)
plt.legend(loc='best')
# Save it to a temporary buffer.
buf = BytesIO()
plt.savefig(buf, format="jpg")
plt.savefig(os.path.join(app.config['UPLOAD_FOLDER'],'plot.jpg'))
plot_url = base64.b64encode(buf.getvalue()).decode('utf8')
#Generating the tables for html tables
tables = [output_df.to_html(classes='data')]
#Generating the titles for html table
titles = output_df.columns.values
return render_template('index.html',column_names=column_names, row_data=row_data, tables=tables, titles=titles,zip=zip,plot_url=plot_url)
except Exception as e:
print("Oops!", e.__class__, "occurred.")
return render_template('index.html',column_names=column_names, row_data=row_data,zip=zip,flash_message=True)
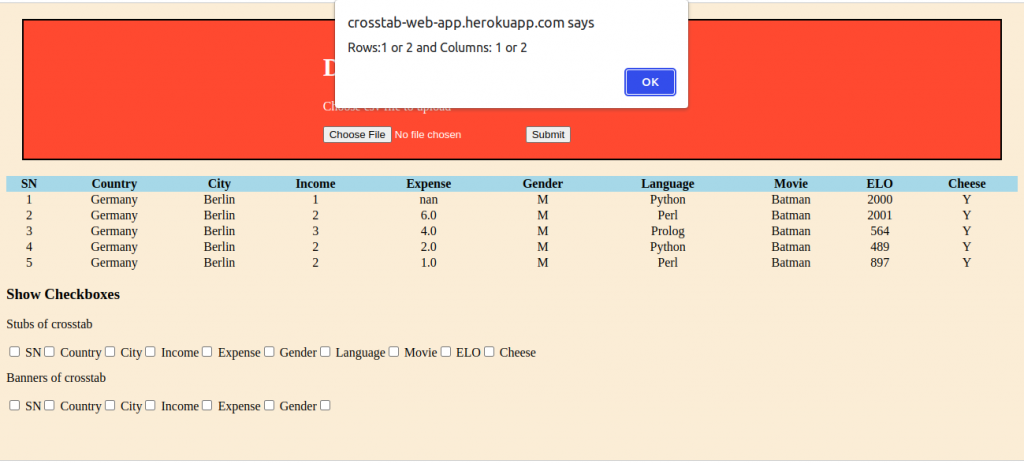
Code for flash message in index.html
<body onload="flashMessage()">
<script>
function flashMessage() {
if ("{{ flash_message }}" == "True") {
alert("Rows:1 or 2 and Columns: 1 or 2");
}
}
</script>Adding to git and pusing to github and heroku
python3 -m pip freeze > requirements.txt
git add .
git commit -m 'plot, flash and exception handling added'
git push heroku main
heroku open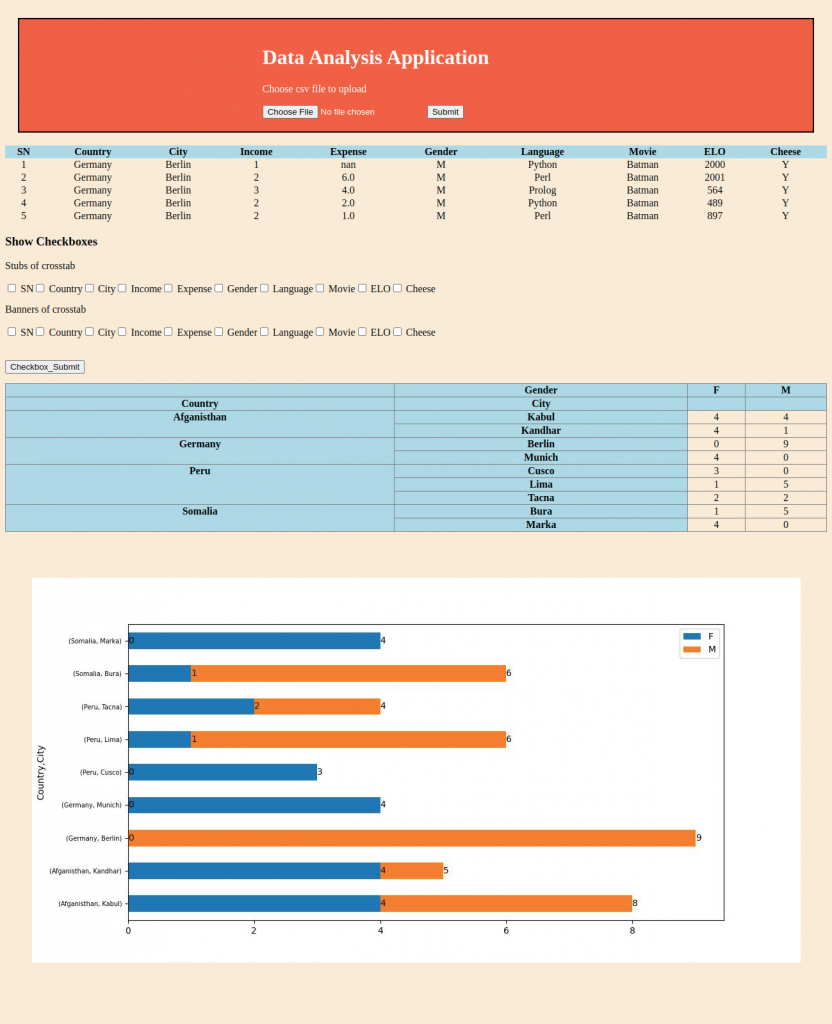
The Problem
Even though we have not uploaded any file, but we can click on ‘submit’ button and this will generate error.
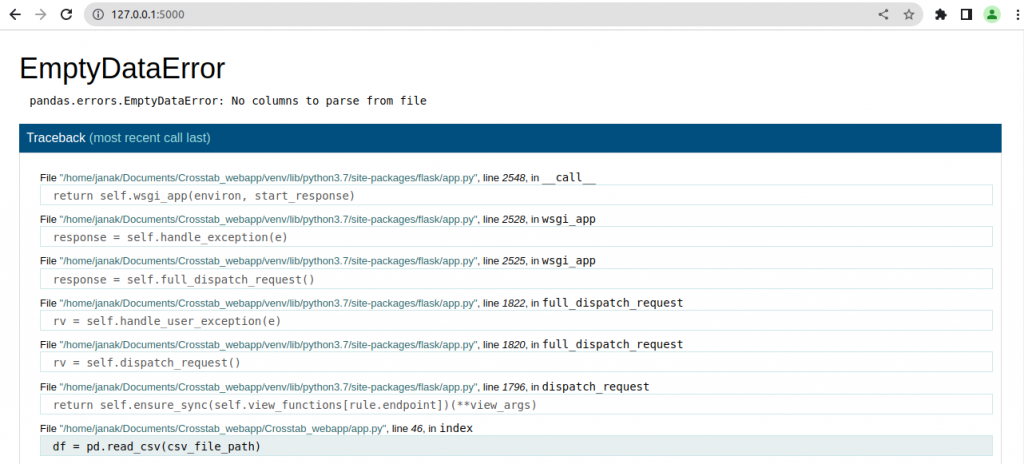
One way to deal this problem is to disable the ‘submit’ button unless the file is selected by the user.
We have added id=”myFile” and id=”myFileSubmit” and will control these ids with the help of javascript.
<form method="POST" enctype="multipart/form-data" action="/">
                <input type="file" id="myFile" name="uploaded-file" accept=".csv">
                <input type="submit" id="myFileSubmit" value="Submit" name="Submit_action">
            </form>
The javascript code: main.js
let input = document.querySelector("#myFile");
let button = document.querySelector("#myFileSubmit");


button.disabled = true; //setting button state to disabled

input.addEventListener("change", stateHandle);

function stateHandle() {
    if (document.querySelector("#myFile").value === "") {
        button.disabled = true; //button remains disabled
    } else {
        button.disabled = false; //button is enabled
    }
}
Adding the javascript file ‘main.js’ in ‘index.html’
This ‘main.js’ file is inside ‘staticFiles/js/’ folder.
</body>
<script type="text/javascript" src="/staticFiles/js/main.js"></script>
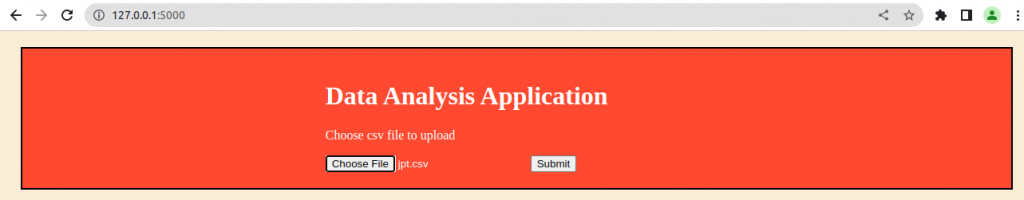
</html>Now we can see the ‘submit’ button is disabled when user has not chosen any file to upload.
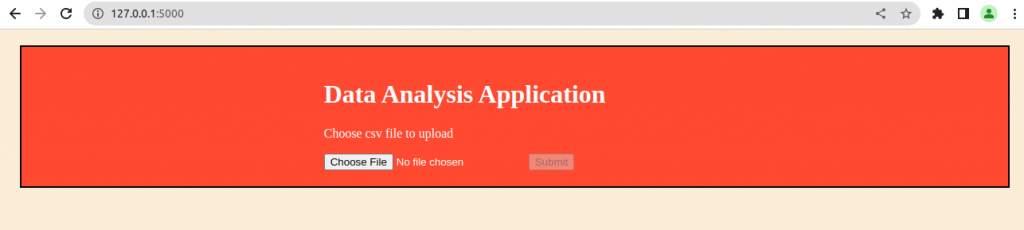
The ‘submit’ button is enabled only after the uses chooses a file to upload.