Pandas

Cross Tabulation in Pandas
The data
Importing the Library and loading the data
import pandas as pd
path = 'path to data'
df = pd.read_csv(path)
df.head()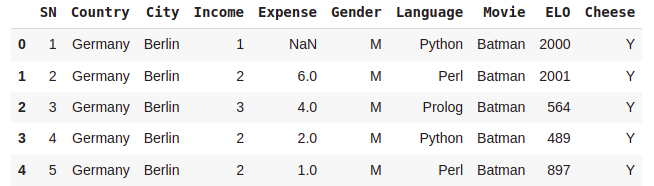
df.columns
Crosstab Basic
#Single index and single column
pd.crosstab(index=df.Country,columns=df.Gender)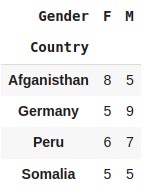
#Different ways of selecting index and columns
pd.crosstab(index=df['Country'],columns=df['Gender'])
pd.crosstab(df['Country'],df['Gender'])
pd.crosstab(df.Country,df.Gender)
#Multiple index single column
pd.crosstab([df.Country,df.City],df.Gender)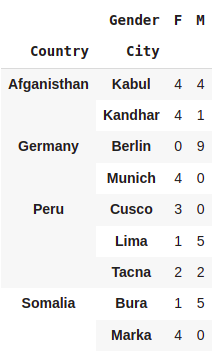
#Single index multiple columns
pd.crosstab([df.Country],[df.Gender,df.Cheese])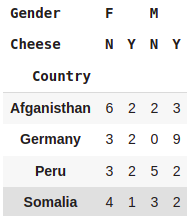
#Multipe index multiple columns
pd.crosstab([df.Country,df.City],[df.Gender,df.Cheese])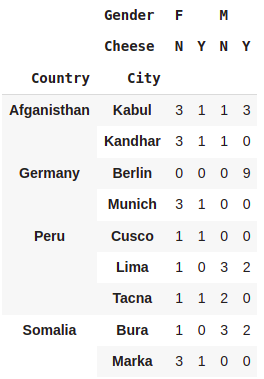
Selection with .loc and .iloc
pd.crosstab(df.Country,df.Gender).loc['Germany']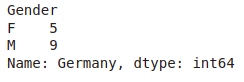
pd.crosstab(df.Country,df.Gender).loc[['Germany']]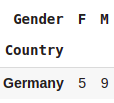
pd.crosstab([df.Country,df.City],df.Gender).loc['Germany']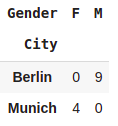
pd.crosstab([df.Country,df.City],df.Gender).loc['Germany','Berlin']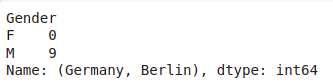
pd.crosstab([df.Country],df.Gender).loc[['Germany','Somalia']]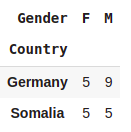
pd.crosstab([df.Country,df.City],[df.Gender,df.Cheese]).loc[['Germany','Peru'],['F']]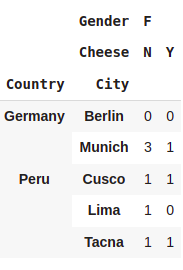
pd.crosstab([df.Country,df.City],df.Gender).loc[[('Germany','Berlin'),('Afganisthan','Kabul')]]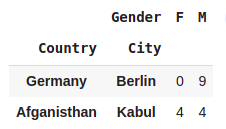
tuple1 = ('Germany','Berlin')
tuple2 = ('Peru','Lima')
tuple3 = ('Afganisthan','Kabul')
tuple4 = ('Afganisthan','Kandhar')
list_of_selection = [tuple1,tuple2,tuple3,tuple3]

pd.crosstab([df.Country,df.City],df.Gender).loc[list_of_selection]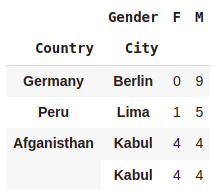
pd.crosstab([df.Country,df.City],df.Gender).loc[[tuple1,tuple2,tuple3]]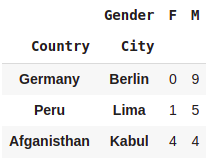
pd.crosstab(df.Country,df.Gender).iloc[0]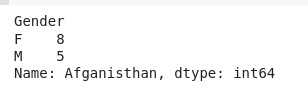
pd.crosstab([df.Country,df.City],df.Gender).iloc[0]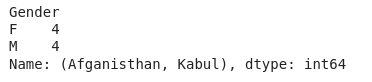
Using basic function with cross tab
pd.crosstab([df.City],[df.Gender]).loc[['Kabul','Lima','Marka']]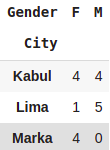
pd.crosstab([df.City],[df.Gender]).loc[['Kabul','Lima','Marka']].max()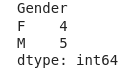
Margins are for total
pd.crosstab([df.Country,df.City],df.Gender,margins=True)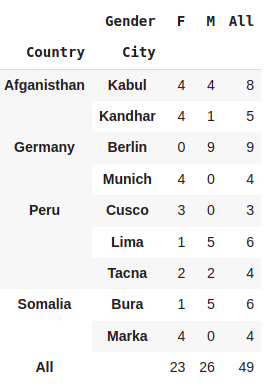
#Renaming the margin
pd.crosstab([df.Country,df.City],df.Gender,margins=True,margins_name="Total")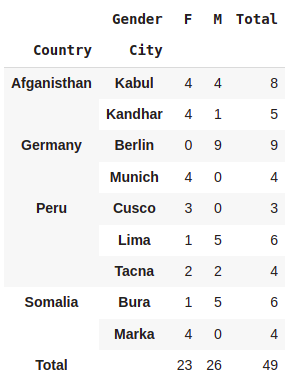
Normalizing Results
pd.crosstab(index=df.Country,columns=df.Gender,normalize=True)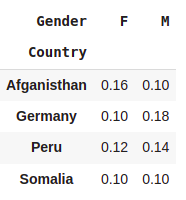
#Percentage calculation
pd.crosstab(index=df.Country,columns=df.Gender,normalize=True)*100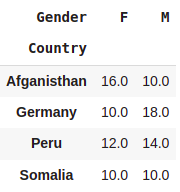
#Normalize by index
pd.crosstab(index=df.Country,columns=df.Gender,normalize='index')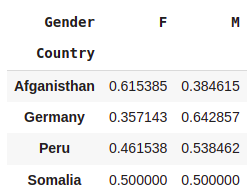
#Normalize by index : the case of multiple indices
pd.crosstab([df.Country,df.City],[df.Gender],normalize='index')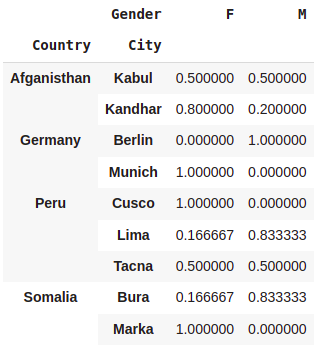
#Normalize by columns
pd.crosstab([df.Country,df.City],[df.Gender],normalize='columns')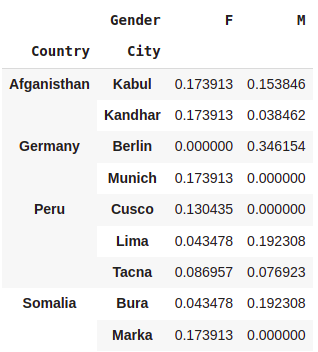
Aggregate function
pd.crosstab([df.Country],[df.Gender],values=df.ELO,aggfunc='sum')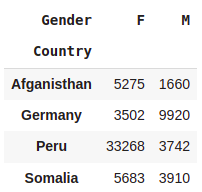
Sorting
pd.crosstab(df.Country.sort_values(ascending=True), df.ELO)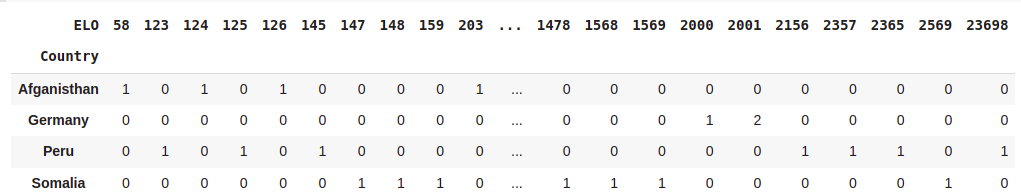
Unique values
pd.crosstab(df.Country,df.Movie).nunique(axis=1)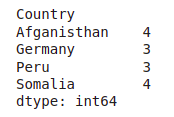
Visualization
(pd.crosstab([df.Country],[df.Gender])).style.background_gradient(cmap='viridis',axis=None)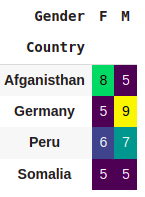
import seaborn as sns
sns.heatmap(pd.crosstab([df.Country], [df.Cheese]),
            cmap="YlGnBu", annot=True, cbar=False)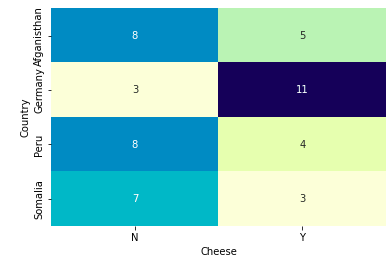
sns.set(rc = {'figure.figsize':(8,8)})
sns.heatmap(pd.crosstab([df.Country], [df.Language],values=df.Income,aggfunc='sum'),
            cmap="YlGnBu", annot=True, cbar=False)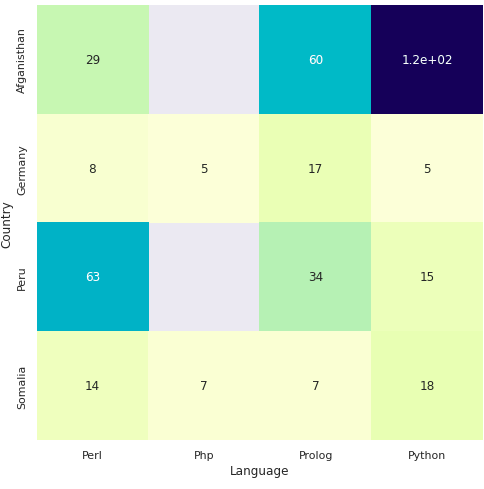
Plotting
df1 = pd.crosstab([df.Country],df.Gender)
df1.plot(kind='bar',figsize=(10,5))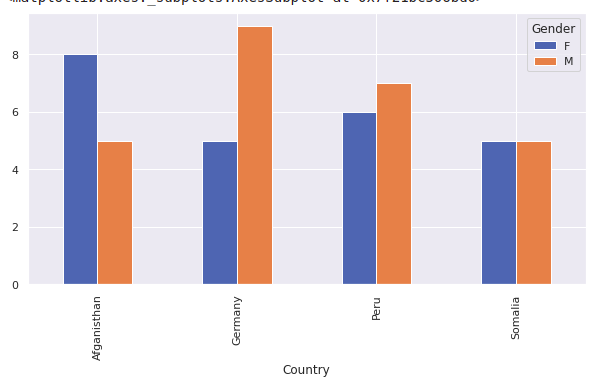
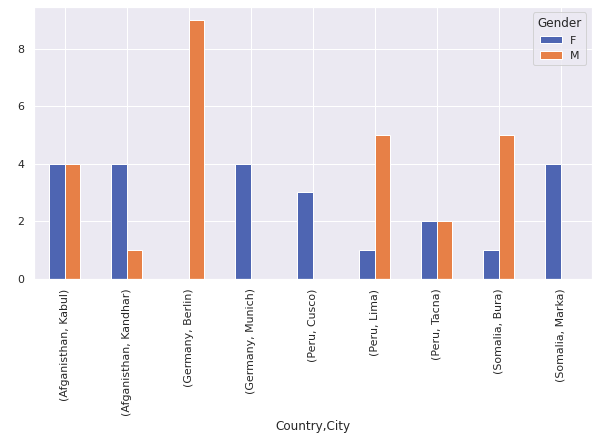
df1 = pd.crosstab([df.Country,df.City],df.Gender)
df1.plot(kind='bar',figsize=(10,5))
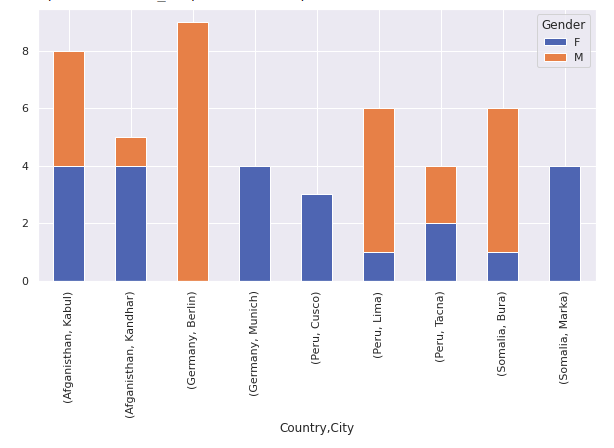
df1 = pd.crosstab([df.Country,df.City],df.Gender)
df1.plot(kind='bar',figsize=(10,5),stacked=True)
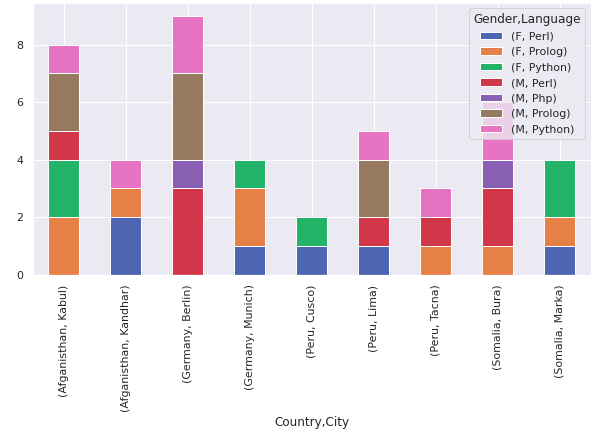
df1 = pd.crosstab([df.Country,df.City],[df.Gender,df.Language])
df1.plot(kind='bar',figsize=(10,5),stacked=True)
pontu
0
Tags :