Chart.js with Django
In this blog, we will learn how visualize data by combining the chart.js with Django. For this we will continue with our Django project from last post Django Admin Customization.
Table of Contents
- Create an Application
- View for JsonResponse
- Data for Pie Chart
- Templates
- PieChart Output
- Adding a Bar Chart
- Adding Chart to Django Admin
Create an Application
Let us start by creating a new application named “myChart”
#terminal
python manage.py startapp myChart
Add the application to the Django project.
INSTALLED_APPS = [
    #3rd party
    "admin_interface",
    "colorfield",


    'django.contrib.admin',
    'django.contrib.auth',
    'django.contrib.contenttypes',
    'django.contrib.sessions',
    'django.contrib.messages',
    'django.contrib.staticfiles',

    'tickets',
    'myChart',

    #3rd party
    'djangoql',
    'import_export',
]
View for JsonResponse
Goto myCharts/views.py and add the following code.
from django.shortcuts import render
from django.http import JsonResponse

from tickets.models import Venue

# Create your views here.
def get_concert_by_venue(request):
    venues_queryset = Venue.objects.all()
    print(venues_queryset)
    venues_list = [venue.name for venue in venues_queryset]
    return JsonResponse({"venues":venues_list})
Create myChart/urls.py and add the following code to it.
from django.urls import path
from . import views

urlpatterns = [
    path("concert_venue/",views.get_concert_by_venue,name="concert_venue"),
]
Edit project level urls.py to add url of this application.
from django.contrib import admin
from django.urls import path,include

urlpatterns = [
    path('primeuser/', admin.site.urls),
    path("chart/",include("myChart.urls")),
]

admin.site.site_title = "Concert Admin"
admin.site.site_header = "Our Concert Administration"
admin.site.index_title = "Our concert administration"
Run the server and visit http://127.0.0.1:7000/chart/concert_venue/ and find the data in json format.

Data For Pie Chart
Our function will read data of all the concerts, group them by venue and the count number of concerts each venue has.
Create folder in root folder and name it utlis and within that folder create a file named chart.py. Edit utlis/charts.py as follow. This is only to help us color our chart later.
colorPalette = ["#55efc4", "#81ecec", "#a29bfe", "#ffeaa7", "#fab1a0", "#ff7675", "#fd79a8"]
colorPrimary, colorSuccess, colorDanger = "#79aec8", colorPalette[0], colorPalette[5]


def generate_color_palette(amount):
    palette = []
    i=0

    while i<len(colorPalette) and len(palette)<amount:
        palette.append(colorPalette[i])
        i +=1
        if i == len(colorPalette) and len(palette) < amount:
            i = 0
    return palette
Again edit myCharts/views.py as follows.
from django.shortcuts import render
from django.http import JsonResponse
from django.db.models import Count

from tickets.models import Venue,Concert
from utlis.chart import colorDanger, colorPalette, colorPrimary,colorSuccess,generate_color_palette


# Create your views here.
def get_concert_by_venue(request):
    concerts_by_venue = Concert.objects.values('venue__name').annotate(concert_count=Count('id'))
    data = list(concerts_by_venue)
    concert_counts = [item['concert_count'] for item in data]

    venues_queryset = Venue.objects.all()
    print(venues_queryset)
    venues_list = [venue.name for venue in venues_queryset]

    return JsonResponse({
        "title":"Concerts by Venue",
        "data":{
            "labels":venues_list,
            "datasets":[{
                "label":"count",
                "backgroundColor":generate_color_palette(len(venues_list)),
                "borderColor":generate_color_palette(len(venues_list)),
                "data":concert_counts,
            }]
        },
        })
Run the server if it is not running and visit http://127.0.0.1:7000/chart/concert_venue/

Now, we have data in required format. Next, we will create template and use chart.js to draw a pie chart.
Templates
Create templates/stats.py file inside your myChart application.
<!DOCTYPE html>
<htm lang="en">
    <head>
        <title>
            Statistics
        </title>
        <script src="https://cdn.jsdelivr.net/npm/chart.js@4.2.1/dist/chart.umd.min.js"></script>
        <script
          src="https://code.jquery.com/jquery-3.6.4.min.js"
          integrity="sha256-oP6HI9z1XaZNBrJURtCoUT5SUnxFr8s3BzRl+cbzUq8="
          crossorigin="anonymous">
        </script>
        <link rel="stylesheet" href="https://cdn.jsdelivr.net/npm/bootstrap-v4-grid-only@1.0.0/dist/bootstrap-grid.min.css">

    </head>
    <body>
        <div class="container">
            <div class="row">
                <div class="col-6">
                    <canvas id="concertVenue"></canvas>
                </div>
            </div>

        </div>

    </body>
</htm>
We loaded our html file with chart.js along with jquery and bootstrap. We also created a canvas with the id of “concertVenue”. This is where we will display our chart.
Add more codes to templates/stats.py
<!DOCTYPE html>
<htm lang="en">
    <head>
        <title>
            Statistics
        </title>
        <script src="https://cdn.jsdelivr.net/npm/chart.js@4.2.1/dist/chart.umd.min.js"></script>
        <script
          src="https://code.jquery.com/jquery-3.6.4.min.js"
          integrity="sha256-oP6HI9z1XaZNBrJURtCoUT5SUnxFr8s3BzRl+cbzUq8="
          crossorigin="anonymous">
        </script>
        <link rel="stylesheet" href="https://cdn.jsdelivr.net/npm/bootstrap-v4-grid-only@1.0.0/dist/bootstrap-grid.min.css">

    </head>
    <body>
        <div class="container">
            <div class="row">
                <div class="col-6">
                    <canvas id="concertVenue"></canvas>
                </div>
            </div>
            <script>

                let concertVenueCtx = document.getElementById("concertVenue").getContext("2d");
                let concertVenueChart = new Chart(concertVenueCtx, {
                    type:'pie',
                    options:{
                        responsive:true,
                        maintainAspectRatio:false,
                        aspectRatio:1,
                        title:{
                            display:false,
                            text:""
                        },
                        layout: {
                            padding:{
                                left:0,
                                right:0,
                                top:0,
                                bottom:25
                            }
                        }
                    }
                });
            </script>
        </div>

    </body>
</htm>
In above code we took our canvas element and defined various aspect of the chart.
<!DOCTYPE html>
<htm lang="en">
    <head>
        <title>
            Statistics
        </title>
        <script src="https://cdn.jsdelivr.net/npm/chart.js@4.2.1/dist/chart.umd.min.js"></script>
        <script
          src="https://code.jquery.com/jquery-3.6.4.min.js"
          integrity="sha256-oP6HI9z1XaZNBrJURtCoUT5SUnxFr8s3BzRl+cbzUq8="
          crossorigin="anonymous">
        </script>
        <link rel="stylesheet" href="https://cdn.jsdelivr.net/npm/bootstrap-v4-grid-only@1.0.0/dist/bootstrap-grid.min.css">

    </head>
    <body>
        <div class="container">
            <div class="row">
                <div class="col-6">
                    <canvas id="concertVenue"></canvas>
                </div>
            </div>
            <script>

                let concertVenueCtx = document.getElementById("concertVenue").getContext("2d");
                let concertVenueChart = new Chart(concertVenueCtx, {
                    type:'pie',
                    options:{
                        responsive:true,
                        maintainAspectRatio:false,
                        aspectRatio:1,
                        title:{
                            display:false,
                            text:""
                        },
                        layout: {
                            padding:{
                                left:0,
                                right:0,
                                top:0,
                                bottom:25
                            }
                        }
                    }
                });
            </script>
        </div>
        <script>
            $(document).ready(function() {
              $.ajax({
                url: "/chart/concert_venue/",
                type: "GET",
                dataType: "json",
                success: (jsonResponse) => {
                    console.log("success");
                    // console.log(jsonResponse);
                    loadChart(concertVenueChart, `/chart/concert_venue/`);
                },
                error: () => console.log("Failed!")
              });
            });


        </script>
    </body>
</htm>
The above function gets called when the document is loaded. It reads the data sent by “/chart/concert_venue/” and when it gets the data successfully it prints “success” on the console. It also calls the functions loadChart(concertVenueChart, `/chart/concert_venue/`); soon to be defined.
<!DOCTYPE html>
<htm lang="en">
    <head>
        <title>
            Statistics
        </title>
        <script src="https://cdn.jsdelivr.net/npm/chart.js@4.2.1/dist/chart.umd.min.js"></script>
        <script
          src="https://code.jquery.com/jquery-3.6.4.min.js"
          integrity="sha256-oP6HI9z1XaZNBrJURtCoUT5SUnxFr8s3BzRl+cbzUq8="
          crossorigin="anonymous">
        </script>
        <link rel="stylesheet" href="https://cdn.jsdelivr.net/npm/bootstrap-v4-grid-only@1.0.0/dist/bootstrap-grid.min.css">

    </head>
    <body>
        <div class="container">
            <div class="row">
                <div class="col-6">
                    <canvas id="concertVenue"></canvas>
                </div>
            </div>
            <script>

                let concertVenueCtx = document.getElementById("concertVenue").getContext("2d");
                let concertVenueChart = new Chart(concertVenueCtx, {
                    type:'pie',
                    options:{
                        responsive:true,
                        maintainAspectRatio:false,
                        aspectRatio:1,
                        title:{
                            display:false,
                            text:""
                        },
                        layout: {
                            padding:{
                                left:0,
                                right:0,
                                top:0,
                                bottom:25
                            }
                        }
                    }
                });
            </script>
        </div>
        <script>
            $(document).ready(function() {
              $.ajax({
                url: "/chart/concert_venue/",
                type: "GET",
                dataType: "json",
                success: (jsonResponse) => {
                    console.log("success");
                    // console.log(jsonResponse);
                    //loadAllCharts();
                    loadChart(concertVenueChart, `/chart/concert_venue/`);
                },
                error: () => console.log("Failed!")
              });
            });


            function loadChart(chart, endpoint) {
              $.ajax({
                url: endpoint,
                type: "GET",
                dataType: "json",
                success: (jsonResponse) => {

                  // Extract data from the response

                  const title = jsonResponse.title;
                  const labels = jsonResponse.data.labels;
                  const datasets = jsonResponse.data.datasets;

                  // Reset the current chart
                  chart.data.datasets = [];
                  chart.data.labels = [];

                  // Load new data into the chart
                  chart.options.title.text = title;
                  chart.options.title.display = true;
                  chart.data.labels = labels;
                  datasets.forEach(dataset => {
                    chart.data.datasets.push(dataset);
                  });
                  chart.update();
                },
                error: () => console.log("Failed to fetch chart data from " + endpoint + "!")
              });
            }


        </script>
    </body>
</htm>
This function take the name of chart and the endpoint as its input. In this case, loadChart(concertVenueChart, `/chart/concert_venue/`); It takes the json data provided by /chart/concert_venue/ and edits the concertVenueChart accordingly.
Now, add following function to myCharts/views.py
...........................................................
def stats_view(request):
    return render(request,"stats.html",{})
Edit myCharts/urls.py
from django.urls import path
from . import views

urlpatterns = [
    path("categories/",views.get_filter_options,name="categories"),
    path("concert_venue/",views.get_concert_by_venue,name="concert_venue"),
    path("stats/",views.stats_view,name="stats_view"),


]
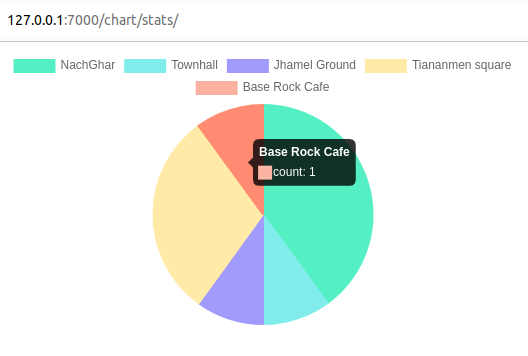
Piechart Output
Run the server and visit http://127.0.0.1:7000/chart/stats/

Adding a Bar Chart
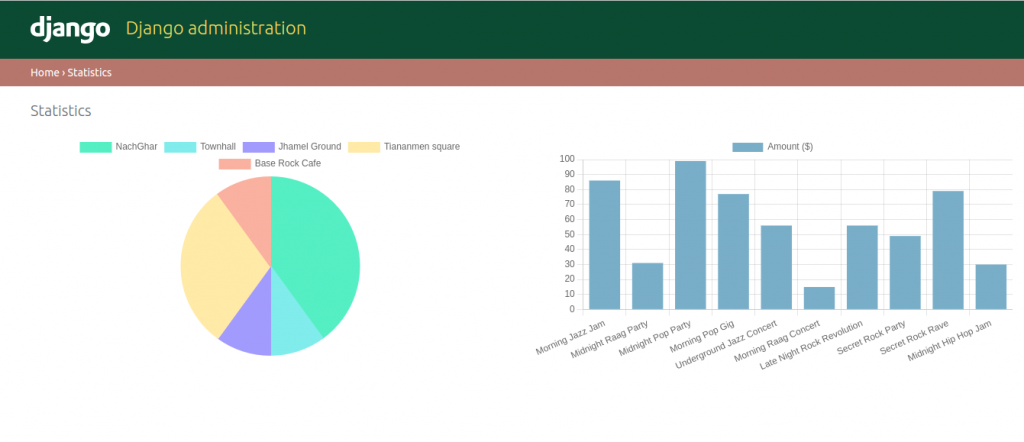
Now, we will add a bar chart showing ticket price of each concert.
Add the following code to myChart/views.py
from django.shortcuts import render
from django.http import JsonResponse
from django.db.models import Count
from django.db.models import F

...............................................................

# Create your views here.
..................................................................

def get_concert_price(request):
    concerts_with_price = Concert.objects.annotate(concert_price=F('price')).values('name','concert_price')
    result_dict = {concert['name']:concert['concert_price'] for concert in concerts_with_price}

    return JsonResponse({
        "title": f"Ticket Price",
        "data":{
            "labels":list(result_dict.keys()),
            "datasets":[{
                "label":"Amount ($)",
                "backgroundColor":colorPrimary,
                "borderColor":colorPrimary,
                "data":list(result_dict.values()),
            }]

        }
    })

def stats_view(request):
    return render(request,"stats.html",{})
The above function will extract the ticket price of each concert and create a dictionary with concerts as keys and ticket price as values. It will return JsonResponse in the format required for our chart.
Now, add code to myChart/urls.py.
from django.urls import path
from . import views

urlpatterns = [
    path("concert_venue/",views.get_concert_by_venue,name="concert_venue"),
    path("concert_ticket/",views.get_concert_price,name="concert_ticket"),
    path("stats/",views.stats_view,name="stats_view"),
]
Run the server and visit: http://127.0.0.1:8000/chart/concert_ticket/

Now, edit templates/stats.html
<div class="row">
                <div class="col-6">
                    <canvas id="concertVenue"></canvas>
                </div>
                <div class="col-6">
                    <canvas id="concertTicket"></canvas>
                </div>
            </div>
Add another canvas and name it “concertTicket”.
<script>

                let concertVenueCtx = document.getElementById("concertVenue").getContext("2d");
                let concertVenueChart = new Chart(concertVenueCtx, {
                    type:'pie',
                    options:{
                        responsive:true,
                        maintainAspectRatio:false,
                        aspectRatio:1,
                        title:{
                            display:false,
                            text:""
                        },
                        layout: {
                            padding:{
                                left:0,
                                right:0,
                                top:0,
                                bottom:25
                            }
                        }
                    }
                });

                let ticketCtx = document.getElementById("concertTicket").getContext("2d");
                let ticketChart = new Chart(ticketCtx, {
                    type:"bar",
                    options: {
                        responsive:true,
                        title:{
                            display:false,
                            text: ""
                        }
                    }
                });


            </script>
Take the canvas defined above and add chart to it.
<script>
            $(document).ready(function() {
              $.ajax({
                url: "/chart/concert_venue/",
                type: "GET",
                dataType: "json",
                success: (jsonResponse) => {
                    console.log("success");
                    // console.log(jsonResponse);
                    loadAllCharts();

                },
                error: () => console.log("Failed!")
              });
            });


            function loadChart(chart, endpoint) {
              $.ajax({
                url: endpoint,
                type: "GET",
                dataType: "json",
                success: (jsonResponse) => {

                  // Extract data from the response

                  const title = jsonResponse.title;
                  const labels = jsonResponse.data.labels;
                  const datasets = jsonResponse.data.datasets;

                  // Reset the current chart
                  chart.data.datasets = [];
                  chart.data.labels = [];

                  // Load new data into the chart
                  chart.options.title.text = title;
                  chart.options.title.display = true;
                  chart.data.labels = labels;
                  datasets.forEach(dataset => {
                    chart.data.datasets.push(dataset);
                  });
                  chart.update();
                },
                error: () => console.log("Failed to fetch chart data from " + endpoint + "!")
              });
            }

            function loadTicketChart(chart,endpoint){
                $.ajax({
                url: endpoint,
                type: "GET",
                dataType: "json",
                success: (jsonResponse) => {
                  // Extract data from the response
                  const title = jsonResponse.title;
                  const labels = jsonResponse.data.labels;
                  const datasets = jsonResponse.data.datasets;

                  // Reset the current chart
                  chart.data.datasets = [];
                  chart.data.labels = [];

                  // Load new data into the chart
                  chart.options.title.text = title;
                  chart.options.title.display = true;
                  chart.data.labels = labels;
                  datasets.forEach(dataset => {
                    chart.data.datasets.push(dataset);
                  });
                  chart.update();
                },
                error: () => console.log("Failed to fetch chart data from " + endpoint + "!")
              });


            }

            function loadAllCharts(){
                loadChart(concertVenueChart, `/chart/concert_venue/`);
                loadTicketChart(ticketChart,'/chart/concert_ticket/');


            }


        </script>
We our document is loaded and the response is success we call the function loadAllCharts, which will inturn call two more functions: loadChart(concertVenueChart, `/chart/concert_venue/`); and loadTicketChart(ticketChart,’/chart/concert_ticket/’);
We have already seen the working mechanism of loadChart(concertVenueChart, `/chart/concert_venue/`);.
Here we defined function loadTicketChart(chart,endpoint) which will take the JsonResponse from the end point and render the chart accordingly. In this case: chart is ticketChart and endpoint is /chart/concert_ticket/ .
The complete code of template/stats.html
<!DOCTYPE html>
<htm lang="en">
    <head>
        <title>
            Statistics
        </title>
        <script src="https://cdn.jsdelivr.net/npm/chart.js@4.2.1/dist/chart.umd.min.js"></script>
        <script
          src="https://code.jquery.com/jquery-3.6.4.min.js"
          integrity="sha256-oP6HI9z1XaZNBrJURtCoUT5SUnxFr8s3BzRl+cbzUq8="
          crossorigin="anonymous">
        </script>
        <link rel="stylesheet" href="https://cdn.jsdelivr.net/npm/bootstrap-v4-grid-only@1.0.0/dist/bootstrap-grid.min.css">

    </head>
    <body>
        <div class="container">
            <div class="row">
                <div class="col-6">
                    <canvas id="concertVenue"></canvas>
                </div>
                <div class="col-6">
                    <canvas id="concertTicket"></canvas>
                </div>
            </div>
            <script>

                let concertVenueCtx = document.getElementById("concertVenue").getContext("2d");
                let concertVenueChart = new Chart(concertVenueCtx, {
                    type:'pie',
                    options:{
                        responsive:true,
                        maintainAspectRatio:false,
                        aspectRatio:1,
                        title:{
                            display:false,
                            text:""
                        },
                        layout: {
                            padding:{
                                left:0,
                                right:0,
                                top:0,
                                bottom:25
                            }
                        }
                    }
                });

                let ticketCtx = document.getElementById("concertTicket").getContext("2d");
                let ticketChart = new Chart(ticketCtx, {
                    type:"bar",
                    options: {
                        responsive:true,
                        title:{
                            display:false,
                            text: ""
                        }
                    }
                });


            </script>
        </div>
        <script>
            $(document).ready(function() {
              $.ajax({
                url: "/chart/concert_venue/",
                type: "GET",
                dataType: "json",
                success: (jsonResponse) => {
                    console.log("success");
                    // console.log(jsonResponse);
                    loadAllCharts();

                },
                error: () => console.log("Failed!")
              });
            });


            function loadChart(chart, endpoint) {
              $.ajax({
                url: endpoint,
                type: "GET",
                dataType: "json",
                success: (jsonResponse) => {

                  // Extract data from the response

                  const title = jsonResponse.title;
                  const labels = jsonResponse.data.labels;
                  const datasets = jsonResponse.data.datasets;

                  // Reset the current chart
                  chart.data.datasets = [];
                  chart.data.labels = [];

                  // Load new data into the chart
                  chart.options.title.text = title;
                  chart.options.title.display = true;
                  chart.data.labels = labels;
                  datasets.forEach(dataset => {
                    chart.data.datasets.push(dataset);
                  });
                  chart.update();
                },
                error: () => console.log("Failed to fetch chart data from " + endpoint + "!")
              });
            }

            function loadTicketChart(chart,endpoint){
                $.ajax({
                url: endpoint,
                type: "GET",
                dataType: "json",
                success: (jsonResponse) => {
                  // Extract data from the response
                  const title = jsonResponse.title;
                  const labels = jsonResponse.data.labels;
                  const datasets = jsonResponse.data.datasets;

                  // Reset the current chart
                  chart.data.datasets = [];
                  chart.data.labels = [];

                  // Load new data into the chart
                  chart.options.title.text = title;
                  chart.options.title.display = true;
                  chart.data.labels = labels;
                  datasets.forEach(dataset => {
                    chart.data.datasets.push(dataset);
                  });
                  chart.update();
                },
                error: () => console.log("Failed to fetch chart data from " + endpoint + "!")
              });


            }

            function loadAllCharts(){
                loadChart(concertVenueChart, `/chart/concert_venue/`);
                loadTicketChart(ticketChart,'/chart/concert_ticket/');


            }


        </script>
    </body>
</htm>
Now run the server and visit http://127.0.0.1:8000/chart/stats/

Adding Chart to Django Admin
Create myChart/admin/stats.html and add following codes to it.
{% extends "admin/base_site.html" %}
{% block content %}

<script src="https://cdn.jsdelivr.net/npm/chart.js@4.2.1/dist/chart.umd.min.js"></script>
<script
  src="https://code.jquery.com/jquery-3.6.4.min.js"
  integrity="sha256-oP6HI9z1XaZNBrJURtCoUT5SUnxFr8s3BzRl+cbzUq8="
  crossorigin="anonymous">
</script>
<link rel="stylesheet" href="https://cdn.jsdelivr.net/npm/bootstrap-v4-grid-only@1.0.0/dist/bootstrap-grid.min.css">

<script>
    $(document).ready(function() {
              $.ajax({
                url: "/chart/concert_venue/",
                type: "GET",
                dataType: "json",
                success: (jsonResponse) => {
                    console.log("success");
                    // console.log(jsonResponse);
                    loadAllCharts();

                },
                error: () => console.log("Failed!")
              });
            });

            function loadChart(chart, endpoint) {
              $.ajax({
                url: endpoint,
                type: "GET",
                dataType: "json",
                success: (jsonResponse) => {

                  // Extract data from the response

                  const title = jsonResponse.title;
                  const labels = jsonResponse.data.labels;
                  const datasets = jsonResponse.data.datasets;

                  // Reset the current chart
                  chart.data.datasets = [];
                  chart.data.labels = [];

                  // Load new data into the chart
                  chart.options.title.text = title;
                  chart.options.title.display = true;
                  chart.data.labels = labels;
                  datasets.forEach(dataset => {
                    chart.data.datasets.push(dataset);
                  });
                  chart.update();
                },
                error: () => console.log("Failed to fetch chart data from " + endpoint + "!")
              });
            }

            function loadTicketChart(chart,endpoint){
                $.ajax({
                url: endpoint,
                type: "GET",
                dataType: "json",
                success: (jsonResponse) => {
                  // Extract data from the response
                  const title = jsonResponse.title;
                  const labels = jsonResponse.data.labels;
                  const datasets = jsonResponse.data.datasets;

                  // Reset the current chart
                  chart.data.datasets = [];
                  chart.data.labels = [];

                  // Load new data into the chart
                  chart.options.title.text = title;
                  chart.options.title.display = true;
                  chart.data.labels = labels;
                  datasets.forEach(dataset => {
                    chart.data.datasets.push(dataset);
                  });
                  chart.update();
                },
                error: () => console.log("Failed to fetch chart data from " + endpoint + "!")
              });


            }

            function loadAllCharts(){
                loadChart(concertVenueChart, `/chart/concert_venue/`);
                loadTicketChart(ticketChart,'/chart/concert_ticket/');


            }


</script>

<div class="row">
    <div class="col-6">
        <canvas id="concertVenue"></canvas>
    </div>
    <div class="col-6">
        <canvas id="concertTicket"></canvas>
    </div>
</div>

<script>

    let concertVenueCtx = document.getElementById("concertVenue").getContext("2d");
    let concertVenueChart = new Chart(concertVenueCtx, {
        type:'pie',
        options:{
            responsive:true,
            maintainAspectRatio:false,
            aspectRatio:1,
            title:{
                display:false,
                text:""
            },
            layout: {
                padding:{
                    left:0,
                    right:0,
                    top:0,
                    bottom:25
                }
            }
        }
    });

    let ticketCtx = document.getElementById("concertTicket").getContext("2d");
    let ticketChart = new Chart(ticketCtx, {
        type:"bar",
        options: {
            responsive:true,
            title:{
                display:false,
                text: ""
            }
        }
    });


</script>

{% endblock %}
This works same as myChart/stats.py
Now, create core/admin.py and add the following code.
from typing import Any
from django.contrib import admin
from django.core.handlers.wsgi import WSGIRequest
from django.shortcuts import render
from django.urls import path
from django.urls.resolvers import URLResolver

def admin_statistics_view(request):
    return render(request,"admin/stats.html",{"title":"Statistics"})


class CustomAdminSite(admin.AdminSite):
    def get_app_list(self, request,_=None):
        app_list = super().get_app_list(request)
        app_list += [{
            "name":"My Custom App",
            "app_label":"my_custom_app",
            "models":[{
                "name":"Statistics",
                "object_name":"statistics",
                "admin_url":"/primeuser/statistics",
                "view_only":True
            }],
        }]

        return app_list

    def get_urls(self):
        urls = super().get_urls()
        urls += [path("statistics/",admin_statistics_view,name="admin-statistics"),
                 ]
        return urls
We created a view named admin_statistics_view.
Then, we created a new AdminSite and overrode get_app_list and add our own custom application to it. We provided our application with an artificial view-only model called Statistics. We also overrode get_urls and assigned a URL to our new View.
Now, create another file core/apps.py
from django.contrib.admin.apps import AdminConfig


class CustomAdminConfig(AdminConfig):
    default_site = "core.admin.CustomAdminSite"
Edit settings.py to replace default AdminConfig with our CustomAdminConfig.
INSTALLED_APPS = [
    #3rd party
    "admin_interface",
    "colorfield",


    #'django.contrib.admin',

    "core.apps.CustomAdminConfig",
    'django.contrib.auth',
    'django.contrib.contenttypes',
    'django.contrib.sessions',
    'django.contrib.messages',
    'django.contrib.staticfiles',

    'tickets',
    'myChart',

    #3rd party
    'djangoql',
    'import_export',
]
Finally update project level urls.py
from django.contrib import admin
from django.urls import path,include

from .admin import admin_statistics_view

urlpatterns = [
    path("primeuser/statistics/",
         admin.site.admin_view(admin_statistics_view),
         name="admin-statistics"),
    path('primeuser/', admin.site.urls),
    path("chart/",include("myChart.urls")),
]

admin.site.site_title = "Concert Admin"
admin.site.site_header = "Our Concert Administration"
admin.site.index_title = "Our concert administration"
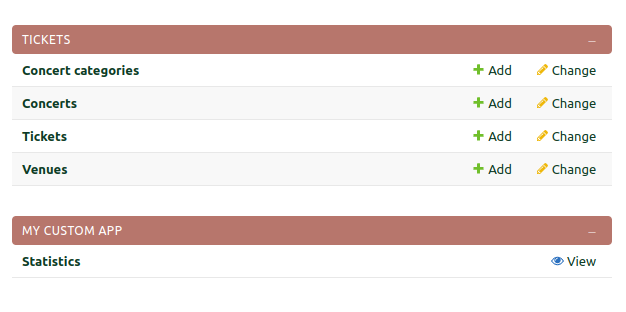
Run the server and visit http://127.0.0.1:8000/primeuser/
Login if you need to

We can see MY CUSTOM APP click view
