")
Azure MLOps for Beginners: Train, Deploy and Serve a GRU forecasting model. (Part II)
In Part I for Azure MLOps for Begineers, we learnt how to train, register and deploy our model in Azure ML. In this part, we will learn how to use that endpoint to make forecast using a Flask Based web application.
For basic Flask setup check : Streamlined Flask Deployment on Azure. We will build our forecasting application on the top of this application.
helper.py
import numpy as np
import pandas as pd
from datetime import datetime, timedelta
from matplotlib import pyplot as plt
import requests
import json
#function to load data from api
def custom_business_week_mean(values):
# Filter out Saturdays
working_days = values[values.index.dayofweek != 5]
return working_days.mean()
#function to read stock data from Nepalipaisa.com api
def stock_dataFrame(stock_symbol,start_date='2020-01-01',weekly=False):
"""
input : stock_symbol
start_data set default at '2020-01-01'
weekly set default at False
output : dataframe of daily or weekly transactions
"""
#print(end_date)
today = datetime.today()
# Calculate yesterday's date
yesterday = today - timedelta(days=1)
# Format yesterday's date
formatted_yesterday = yesterday.strftime('%Y-%-m-%-d')
print(formatted_yesterday)
path = f'https://www.nepalipaisa.com/api/GetStockHistory?stockSymbol={stock_symbol}&fromDate={start_date}&toDate={formatted_yesterday}&pageNo=1&itemsPerPage=10000&pagePerDisplay=5&_=1686723457806'
df = pd.read_json(path)
theList = df['result'][0]
df = pd.DataFrame(theList)
#reversing the dataframe
df = df[::-1]
#removing 00:00:00 time
#print(type(df['tradeDate'][0]))
df['Date'] = pd.to_datetime(df['tradeDateString'])
#put date as index and remove redundant date columns
df.set_index('Date', inplace=True)
columns_to_remove = ['tradeDate', 'tradeDateString','sn']
df = df.drop(columns=columns_to_remove)
new_column_names = {'maxPrice': 'High', 'minPrice': 'Low', 'closingPrice': 'Close','volume':'Volume','previousClosing':"Open"}
df = df.rename(columns=new_column_names)
if(weekly == True):
weekly_df = df.resample('W').apply(custom_business_week_mean)
df = weekly_df
return df
def create_sequences(df, window_size=5):
"""
Create input-output sequences for time series forecasting.
Parameters:
- df: pandas DataFrame with 'Close' column
- window_size: number of days to use as input (default 5)
Returns:
- X: numpy array of shape (n_samples, window_size) containing input sequences
- y: numpy array of shape (n_samples,) containing target prices
"""
close_prices = df['Close'].values
X = []
y = []
print("****************************************")
# Create sliding windows
for i in range(len(close_prices) - window_size):
# Get the window of features
window = close_prices[i:i+window_size]
X.append(window)
# Get the target (next day's close)
target = close_prices[i+window_size]
y.append(target)
return np.array(X), np.array(y)
def inference(X):
# Define the input JSON payload
payload = json.dumps({"data": X.tolist()})
# Get the deployment endpoint
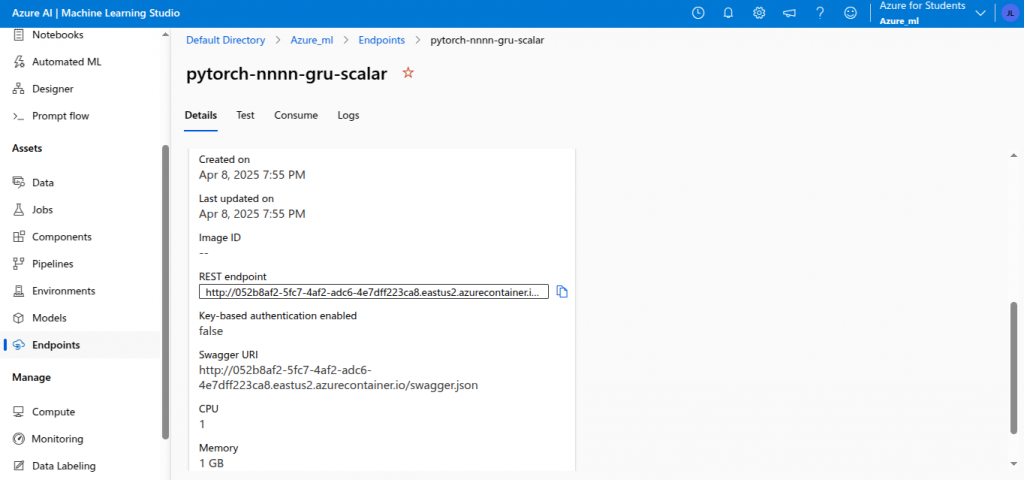
scoring_uri = "http://052b8af2-5fc7-4af2-adc6-4e7dff223ca8.eastus2.azurecontainer.io/score"
headers = {"Content-Type": "application/json"}
# Send request to the deployed model
response = requests.post(scoring_uri, data=payload, headers=headers)
# Print response
# print("Response:", response.json())
return response.json()This file contains functions to get data, format it and an inference to send data to the endpoint.
scoring_uri = “http://052b8af2-5fc7-4af2-adc6-4e7dff223ca8.eastus2.azurecontainer.io/score”
This will be different for you endpoint. You can fit it in your endpoint.
app.py
Update your app.py as follows.
from flask import Flask, render_template, request
import pandas as pd
import plotly.express as px
import numpy as np
from helper import stock_dataFrame, create_sequences, inference

app = Flask(__name__)

def generate_plotly_plot(result_df, symbol):
    """Generate an interactive Plotly plot and return its HTML div."""
    fig = px.line(result_df, x=result_df.index, y=['Actual', 'Predicted'],
                  markers=True, title=f'Actual vs Predicted Stock Prices for {symbol}')

    fig.update_layout(
        xaxis_title="Date",
        yaxis_title="Stock Price",
        template="plotly_white",
        legend_title="Legend"
    )

    return fig.to_html(full_html=False)  # Return only the div content

def calculate_mape(y_actual, y_pred):
    """Calculate Mean Absolute Percentage Error (MAPE)."""
    y_actual, y_pred = np.array(y_actual), np.array(y_pred)
    return np.mean(np.abs((y_actual - y_pred) / y_actual)) * 100

@app.route('/', methods=['GET', 'POST'])
def home():
    df_html = None
    plot_html = None
    mape_value = None
    forecasted_price = None  # Store next-day forecast

    if request.method == 'POST':
        symbol = request.form.get('symbol')
        if symbol:
            df = stock_dataFrame(symbol)
            df.reset_index(inplace=True)

            # Create sequences
            X, y = create_sequences(df)
            print(X.shape)
            print(type(X))

            # Convert NumPy arrays to lists
            y_list = y.tolist()
            prediction = inference(X)
            print(X[-5:])
            prediction_list = prediction
            print(prediction_list[-5:])

            # Take only the last 'len(y)' dates from df
            df_dates = df.iloc[-len(y):]['Date'].values

            # Create DataFrame for predictions
            result_df = pd.DataFrame({
                'Date': df_dates,
                'Actual': y_list,
                'Predicted': prediction_list
            })
            result_df.set_index('Date', inplace=True)

            # Calculate MAPE
            mape_value = calculate_mape(y_list, prediction_list)

            # Select last 10 records for display
            result_df_tail = result_df.tail(10)
            df_html = result_df_tail.to_html(classes='table table-striped table-bordered')

            # Generate interactive plot
            plot_html = generate_plotly_plot(result_df, symbol)

            # # --- 🔹 Next-Day Forecast ---
            print(df.tail())
            df =df[['Close']]
            last_5_days = df.iloc[-5:]
            print(f"Last 5 days: {last_5_days}")
            last_5_days_array = last_5_days.values
            last_5_days_array = last_5_days_array.reshape(1, 5)
            print(last_5_days_array.shape)
            print(type(last_5_days_array))


            forecasted_price = inference(last_5_days_array)  # Pass list to inference()
            print(forecasted_price)
            forecasted_price = round(float(forecasted_price[0]), 2)  # Convert to readable format

    return render_template('index.html', df_html=df_html, plot_html=plot_html,
                           mape_value=mape_value, forecasted_price=forecasted_price)


if __name__ == '__main__':
    app.run(debug=True)
This codes loads the data, sends it to endpoint and forecast the future price of the stock. Apart from that, it also plots the actual vs prediction.
index.html
Only app.py is not enough for a flask app to run, update your index.html with the following code.
<!DOCTYPE html>
<html lang="en">
<head>
<meta charset="UTF-8">
<meta name="viewport" content="width=device-width, initial-scale=1.0">
<title>Stock Prediction</title>
<link rel="stylesheet" href="https://cdn.jsdelivr.net/npm/bootstrap@5.3.0/dist/css/bootstrap.min.css">
<script src="https://cdn.plot.ly/plotly-latest.min.js"></script> <!-- Include Plotly -->
</head>
<body>
<div class="container mt-5">
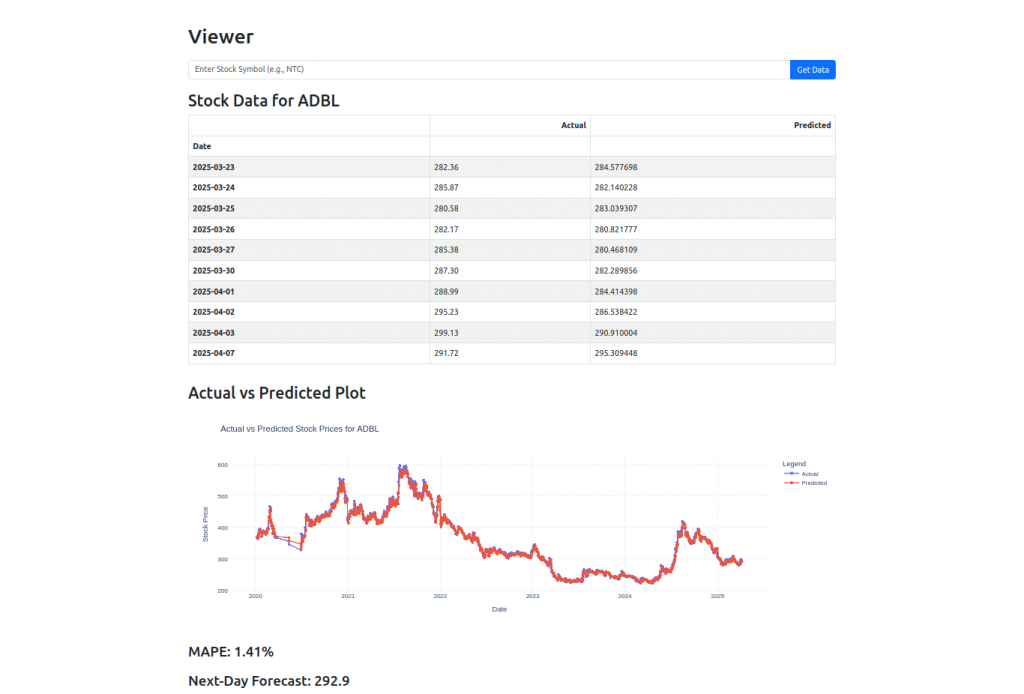
<h1 class="mb-4">Viewer</h1>
<!-- Form for Stock Symbol Input -->
<form method="POST" class="mb-4">
<div class="input-group">
<input type="text" name="symbol" class="form-control" placeholder="Enter Stock Symbol (e.g., NTC)" required>
<button type="submit" class="btn btn-primary">Get Data</button>
</div>
</form>
<!-- Display DataFrame if Available -->
{% if df_html %}
<h2 class="mt-4">Stock Data for {{ request.form.get('symbol') }}</h2>
<div class="table-responsive">
{{ df_html | safe }}
</div>
<!-- Display the Plotly Plot -->
<h2 class="mt-4">Actual vs Predicted Plot</h2>
<div>
{{ plot_html | safe }} <!-- Render Plotly HTML -->
</div>
{% endif %}
{% if mape_value is not none %}
<h3 class="mt-4">MAPE: {{ "%.2f"|format(mape_value) }}%</h3>
{% endif %}
{% if forecasted_price is not none %}
<h3 class="mt-4">Next-Day Forecast: {{ forecasted_price }}</h3>
{% endif %}
</div>
</body>
</html>
Test
First test locally.
python app.pyIf you find it satisfying, push it in gihub. Since we have connected our github to Azure, the changes will appear in flask application hosted on Azure. Run your app and test it.
Conclusion
We finally created a web application that is able to forecast the future stock price.
But there are other MLOps consideration, such as model monitoring, data drift, scaling etc. We will learn to deal with those in coming tutorials.